Uncovering a True Picture of Systematic Internaliser Liquidity
19 November 2018
/
big xyt
/
Views
big xyt
By Mark Montgomery, Strategy & Business Development, big xyt
When navigating through the complexities of European equity liquidity, one could be forgiven for wondering whether, for many market participants, the changes in regulation brought about since January 2018 through MiFID II have been a help or a hindrance. MiFID II was designed to introduce more transparency. But have aspects of it made the markets more opaque?
One example is around the proliferation of Systematic Internalisers (SIs). Although this category of market participant was actually introduced under MiFID I, it has only really seen greater adoption since MiFID II outlawed Broker Crossing Networks (BCNs) and in so doing blocked the systematic matching of client to client orders. The SI regime created an alternative way for investment banks to match proprietary positions with a variety of other flow. It also created a stage for non-bank Electronic Liquidity Providers (ELPs) to operate more publicly in a market-making capacity, through more direct interaction with end clients and their intermediaries.
Doing away with this anonymity has been a bonus for the level of trust that can only be shared between market participants when we have greater awareness of who we are dealing with. However, the regulator has only gone so far and whilst most anonymity has dissolved, the confidentiality has not. In other words, although we have a better idea in certain circumstances who is on the other side of our trade, their intent and – more importantly – their investment horizon is not so clear. This situation might be ideal for a select few participants at particular times, but caveat emptor still applies.
In order to really understand the nature of the liquidity we interact with, we need some concept of history to combine with the available information about who we may be transacting against. How was my experience trading against this counterparty in the past? Is it consistent? Do they represent long or short-term investment strategies? Are they seeking to sniff out a quick opportunity or do they have a large position to move quietly? The data can help us to put this jigsaw together, however many clues may still remain unanswered as the reported SI volumes can represent so many different types of underlying trades.
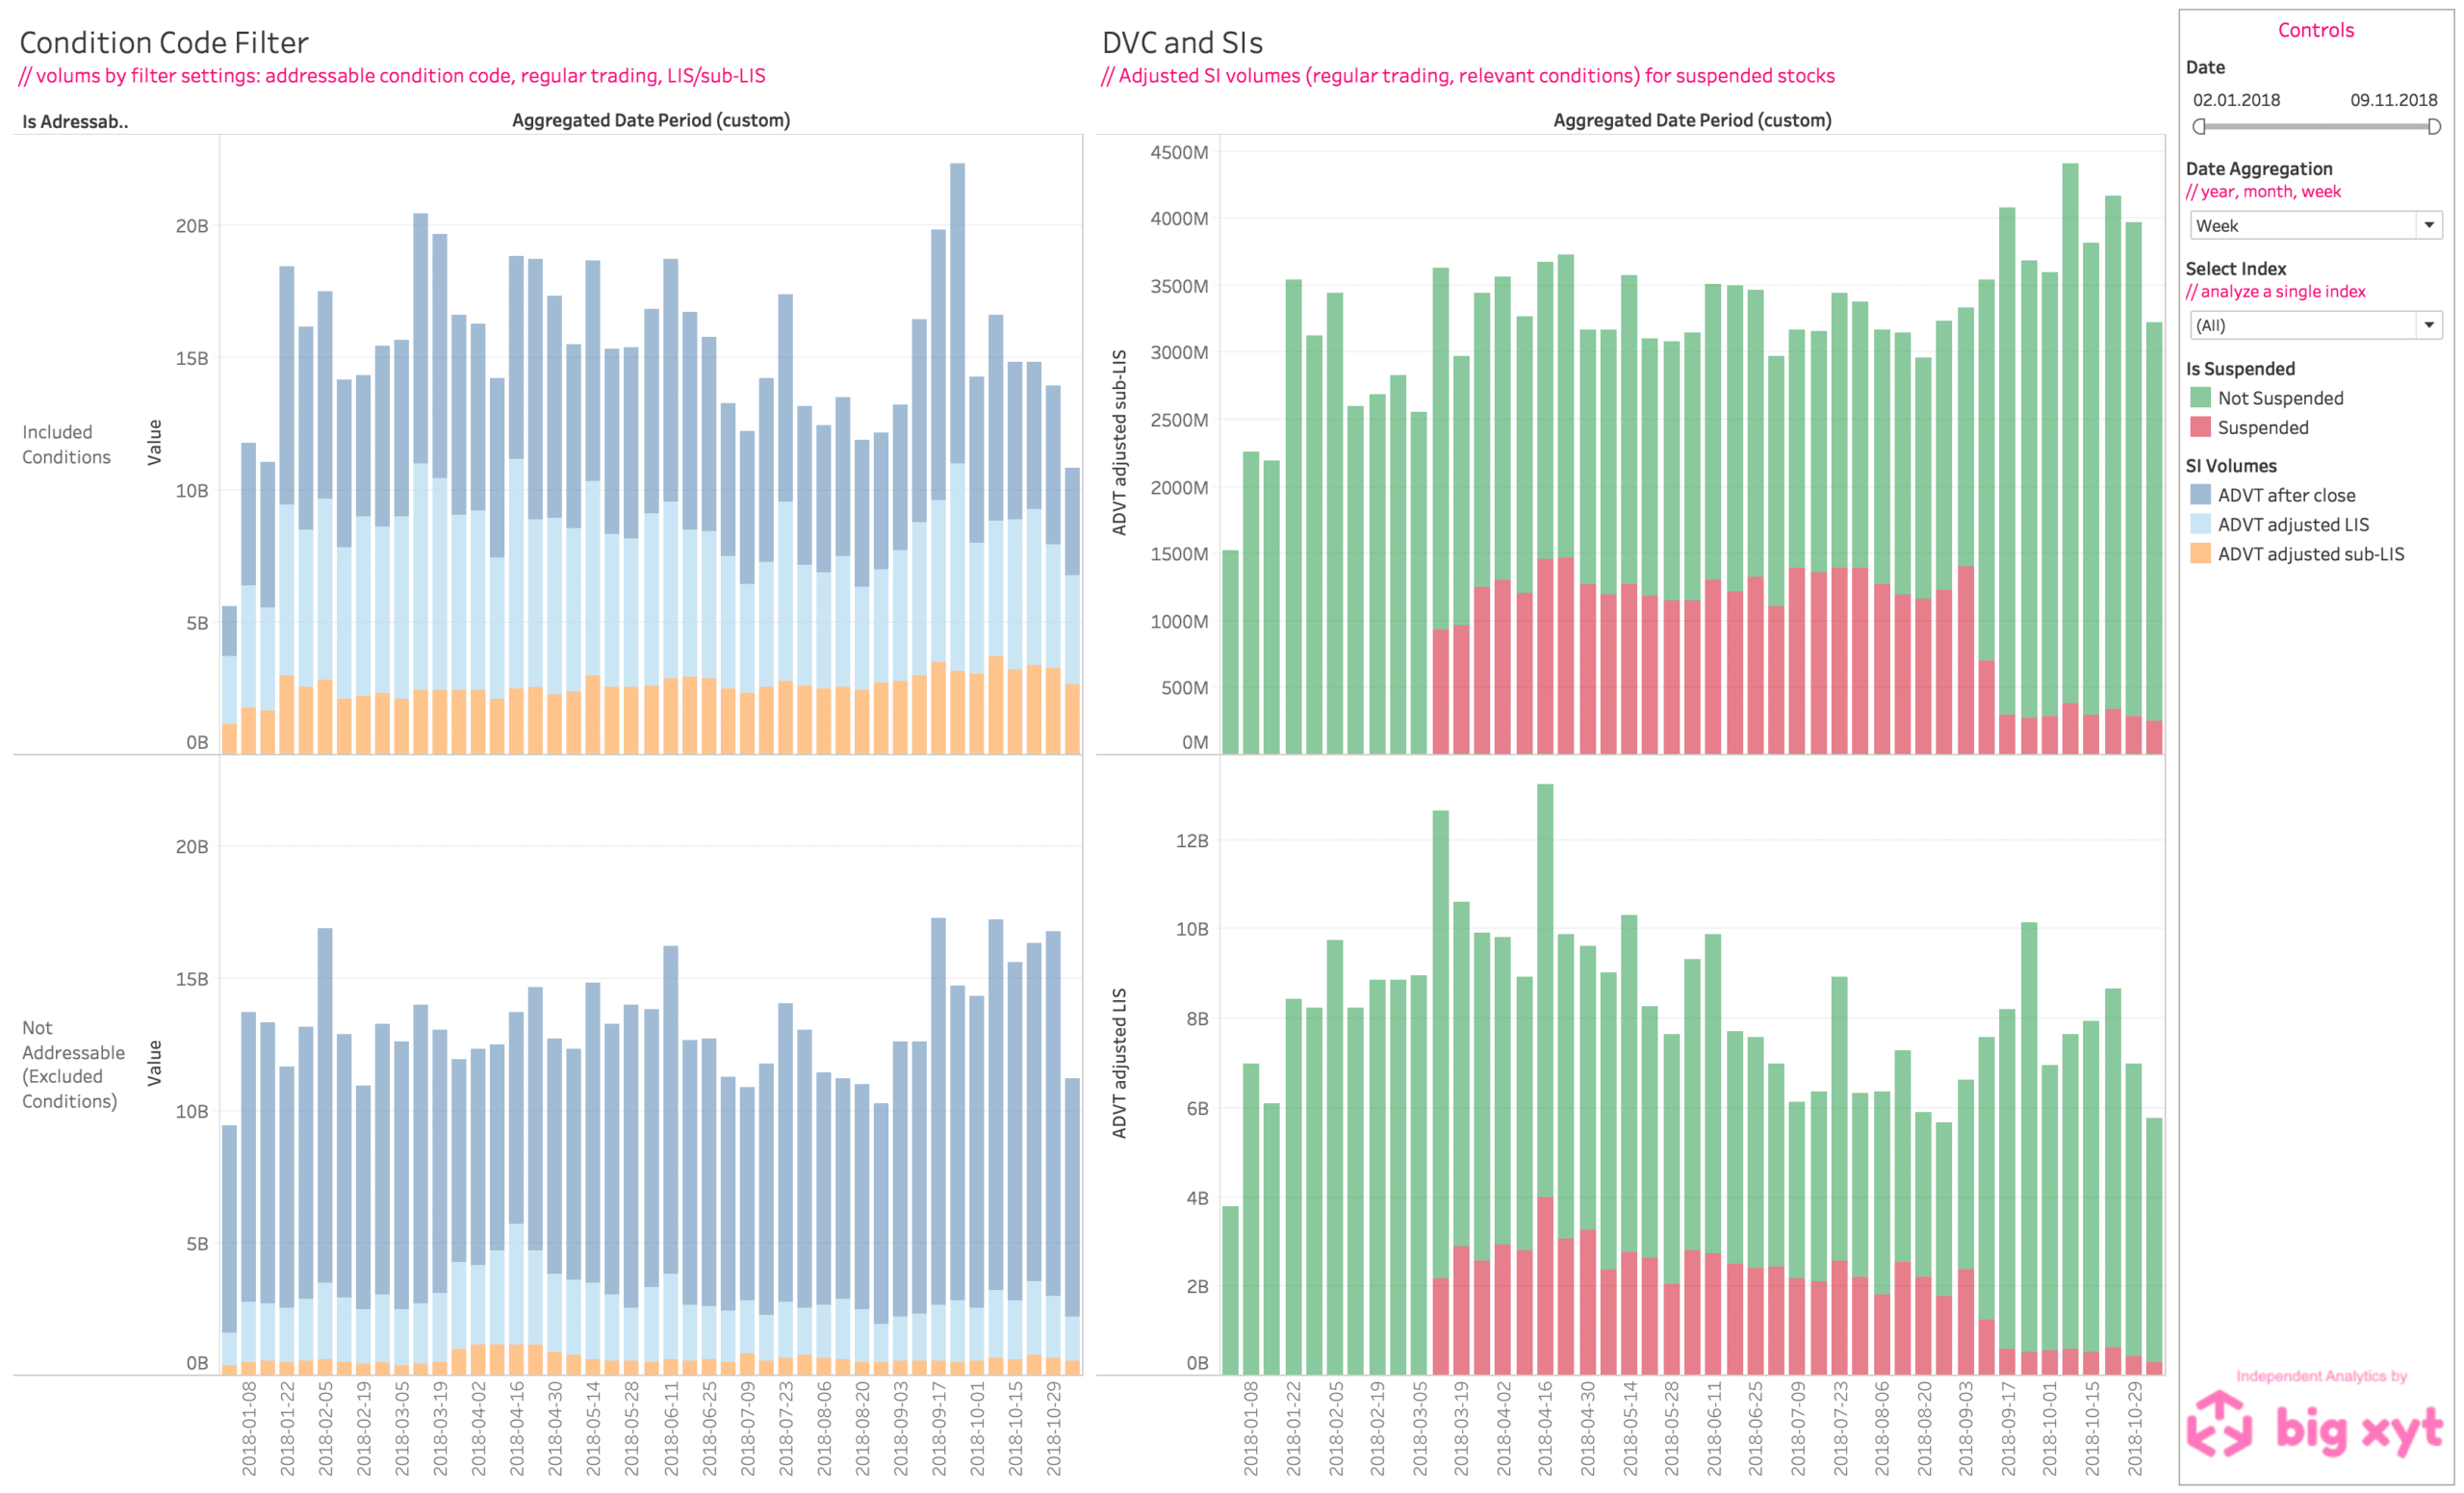
It is therefore important to be able to identify what SI flow is genuinely addressable by the market in general versus that which would not be considered tangible liquidity. Fortunately, there are ways to identify and exclude some of this non-addressable flow. By pinpointing certain trade condition codes we can isolate and reject non-price forming trades, duplicate trades and other ‘technical’ trades. With the right tools, after-hours trades can also be excluded as not addressable during market hours. More recently, with assumed LIS (large in scale) thresholds, it has been possible to optionally exclude blocks as unlikely to be part of typical addressable SI activity.
Filtering out this noise reduces average daily gross pan-European SI volumes from €30bn to less than €5bn, a significant adjustment that shows just how important it is to have the necessary tools to be able to uncover a true picture of real SI liquidity.
Related Insights
15 July 2025
Modernising Market Transparency: Our Understanding of the FCA Consultation Paper CP25/20
The UK Financial Conduct Authority’s (FCA) July 2025 Consultation Paper CP25/20 marks a notable moment in the evolution …
08 July 2025
The Finance Hive’s CMX 2025: What Multi-Asset Buy-Side Desks Need from TCA
At The Finance Hive’s CMX 2025, our TCA workshop focused on how trading desks are adapting their daily workflows – using…
04 June 2025
Scaling European Equity and ETF Data Processing To Deliver the Consolidated Tape
Laying the technological and operational foundation is essential for the European Consolidated Tape (CT). Our infrastruc…