

book a demo member login
XYT_LOGO_LIGHT_RGB
Solutions
Market Intelligence
Liquidity, market share and market quality - how your names really trade.
Transaction Cost Analysis
Performance on the SMART benchmark, against the market that actually traded.
Pre-trade modelling
Know the cost before you send it - modelled on the addressable core.
Datashop - Data & APIs
Analysis-ready datasets, on your schedule, in your format.
xyt AI
Ask in plain English - transparent answers on the same trusted record.
✦ New
xyt AI
Ask xyt in plain English, or plug xyt into your own AI - compatible with any model.
Discover xyt AI →
Across Equities · ETFs · Listed derivatives · FX · Fixed income Real-time + historical · 120+ venues · 10 yrs history
Who we serve
ETF Issuers
Liquidity, market-maker oversight, execution quality.
Asset Managers
Mechanism, timing, best execution.
Banks & Brokers
Independent benchmarks for flow.
Market Makers
The issuer lens; price competitively.
Exchanges & Venues
Where flow prints and share moves.
Insights
About
Contact
Contact

New dark pools map reveals cosmic mystery

28 May 2021
/
big xyt
/
Views

big xyt

We’re not too sure what all the excitement is about… at big xyt we have been researching the changing shape of the dark landscape for years. In fact, rather like long established theories, on the face of it European dark trading volumes have remained relatively steady.

Our team of curious data scientists likes to help the trading community to explore a bit deeper and it’s easy to see that Pan-European dark volumes have been in a fairly tight range with around 8% share of adjusted (our proxy for addressable volumes) for some time, only getting squeezed temporarily with the onset of double volume caps in mid 2018. 

However if you scratch beneath the surface you will see a different story emerging in the UK: 12% of trading in blue chip stocks is now in the dark and over 15% of mid caps are trading this way (see the chart below) – pretty much double the Pan-European average. 

We believe there’s a good reason why… but not all theories apply forever.

Market Share for UK250 Stocks
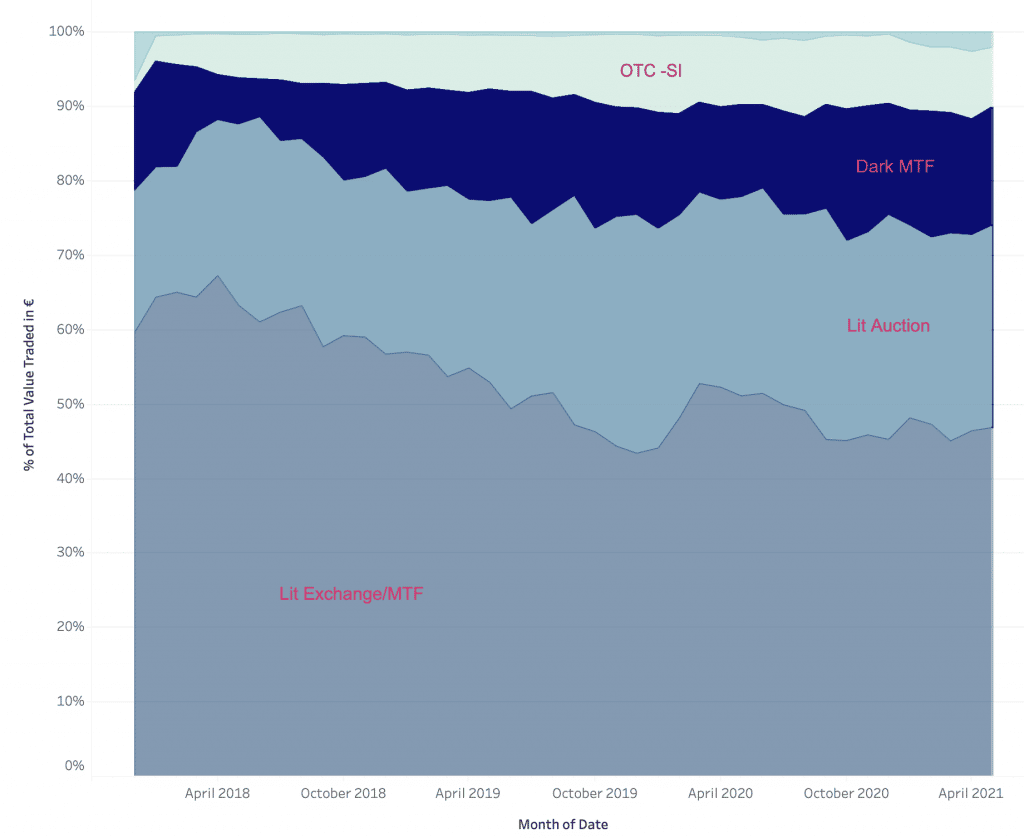
Market Share of UK250 stocks

Something Powerful

Tell The Reader More

The headline and subheader tells us what you're offering, and the form header closes the deal. Over here you can explain why your offer is so great it's worth filling out a form for.

Remember:

  • Bullets are great
  • For spelling out benefits and
  • Turning visitors into leads.

Related Insights

15 July 2025

Modernising Market Transparency: Our Understanding of the FCA Consultation Paper CP25/20

The UK Financial Conduct Authority’s (FCA) July 2025 Consultation Paper CP25/20 marks a notable moment in the evolution …

Modernising Market Transparency: Our Understanding of the FCA Consultation Paper CP25/20

08 July 2025

The Finance Hive’s CMX 2025: What Multi-Asset Buy-Side Desks Need from TCA

At The Finance Hive’s CMX 2025, our TCA workshop focused on how trading desks are adapting their daily workflows – using…

The Finance Hive’s CMX 2025: What Multi-Asset Buy-Side Desks Need from TCA

04 June 2025

Scaling European Equity and ETF Data Processing To Deliver the Consolidated Tape

Laying the technological and operational foundation is essential for the European Consolidated Tape (CT). Our infrastruc…

Scaling European Equity and ETF Data Processing To Deliver the Consolidated Tape
pieArtboard 24 1

Get in contact with the xyt team to learn more.

Contact us
footer-logo
  • Solutions
  • News & Insights
  • Careers
  • About
  • Contact us
  • Support
member login
Follow us
linkin twiter

©2026. All rights reserved.  | Privacy | Imprint