
Liquidity is one of the defining strengths of exchange-traded funds (ETFs), but understanding how they behave across different trading venues and trade sizes remains a complex task – particularly in Europe, where the secondary market structure differs significantly from the U.S.
In Europe, request-for-quote (RFQ) platforms now account for approximately 44% of all ETF trading activity. These platforms have traditionally been used for larger trades, offering bespoke pricing from multiple liquidity providers. However, in recent years, smaller trades have increasingly appeared on RFQ venues, prompting a deeper investigation into execution quality.
Analysing RFQ Trades with Pre-trade Transparency
A key limitation in evaluating RFQ markets has been the lack of pre-trade data. However, for a subset of RFQ trades, two-sided pre-trade information is available, allowing us to calculate the RFQ spread and compare it directly to the EBBO (European Best Bid and Offer) spread available on exchanges.
We analysed all such RFQ trades executed in 2024 and segmented the results by trade size. This gave us a clear view into how pricing compares across different liquidity channels and trade volumes.
Key Observations
- RFQ spreads are consistently wider than EBBO spreads, regardless of trade size.
- The difference is most significant for smaller trades (less than €500,000),where RFQ spreads were between50% and more than 200% wider than the corresponding EBBO spreads.
- Spread variation is ETF-specific: even for similar trade sizes, the relative difference between RFQ and EBBO spreads varies substantially across individual products.
These results suggest that the perceived efficiency of RFQ execution – especially for smaller trades – may not always align with actual pricing competitiveness.
Chart 1: Relative Difference Between RFQ and EBBO Spreads Across All ETFs (2024)
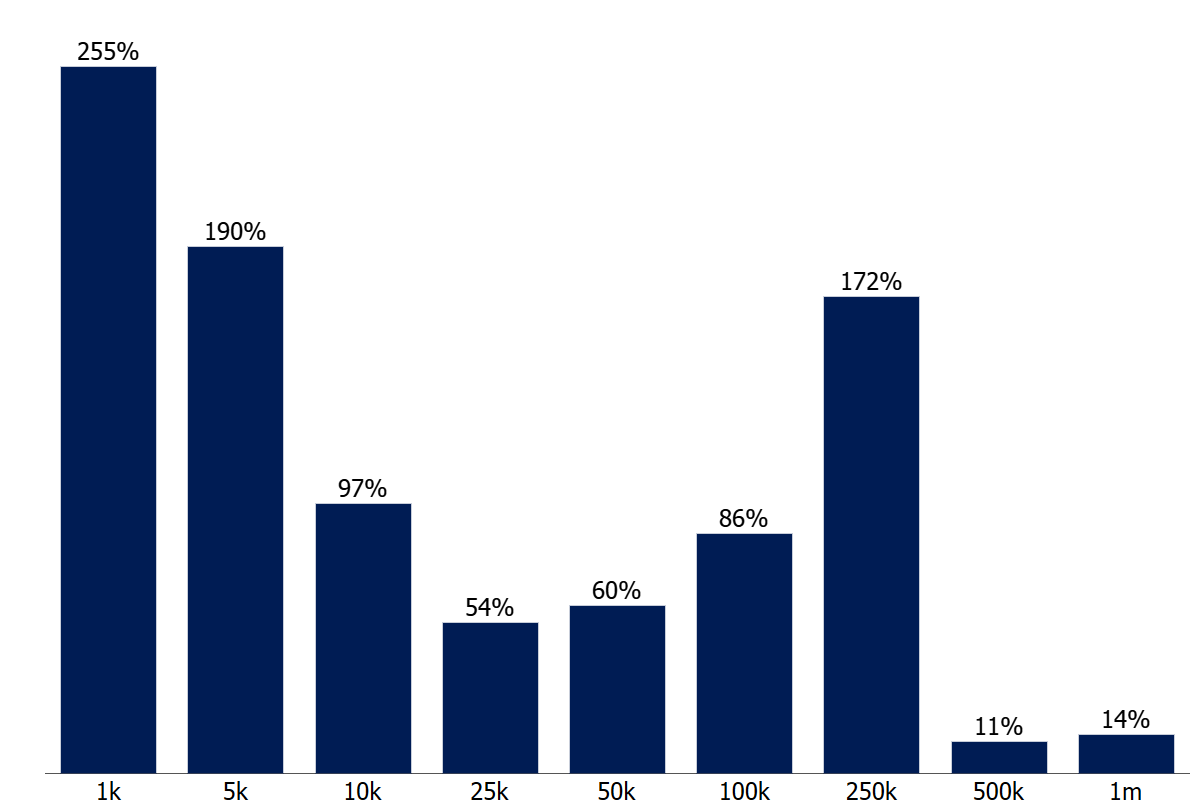
This chart shows the percentage difference between RFQ spreads and EBBO spreads for all ETFs with two-sided pre-trade information traded in 2024. It highlights the extent to which RFQ execution pricing exceeds the prevailing exchange best bid and offer, with notable variations across the ETF universe.
Chart 2: RFQ vs EBBO Spreads for SWDA (in Basis Points)
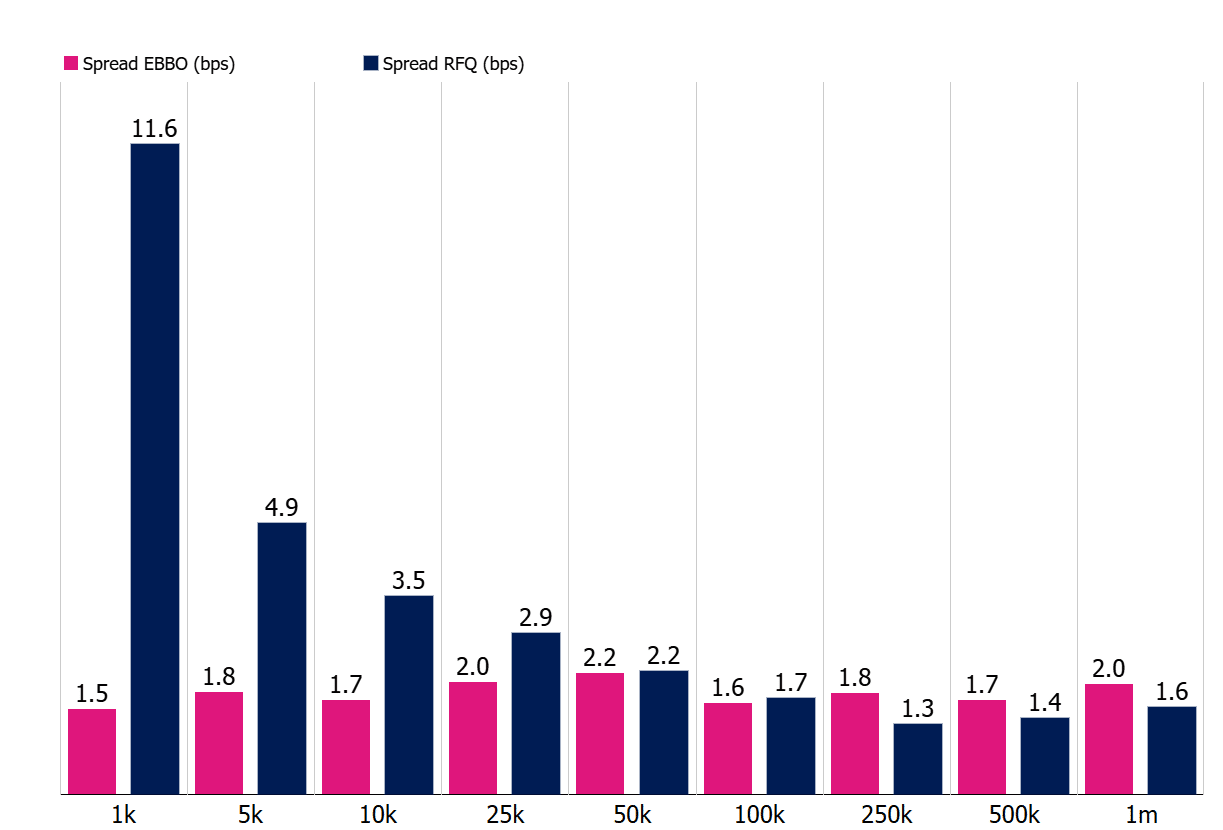
This chart compares the average RFQ spread and the EBBO spread, both measured in basis points, for the iShares MSCI World UCITS ETF (SWDA). The data reveals how pricing on RFQ platforms diverges from exchange benchmarks for this globally diversified equity ETF.
Chart 3: RFQ vs EBBO Spreads for IHYG (in Basis Points)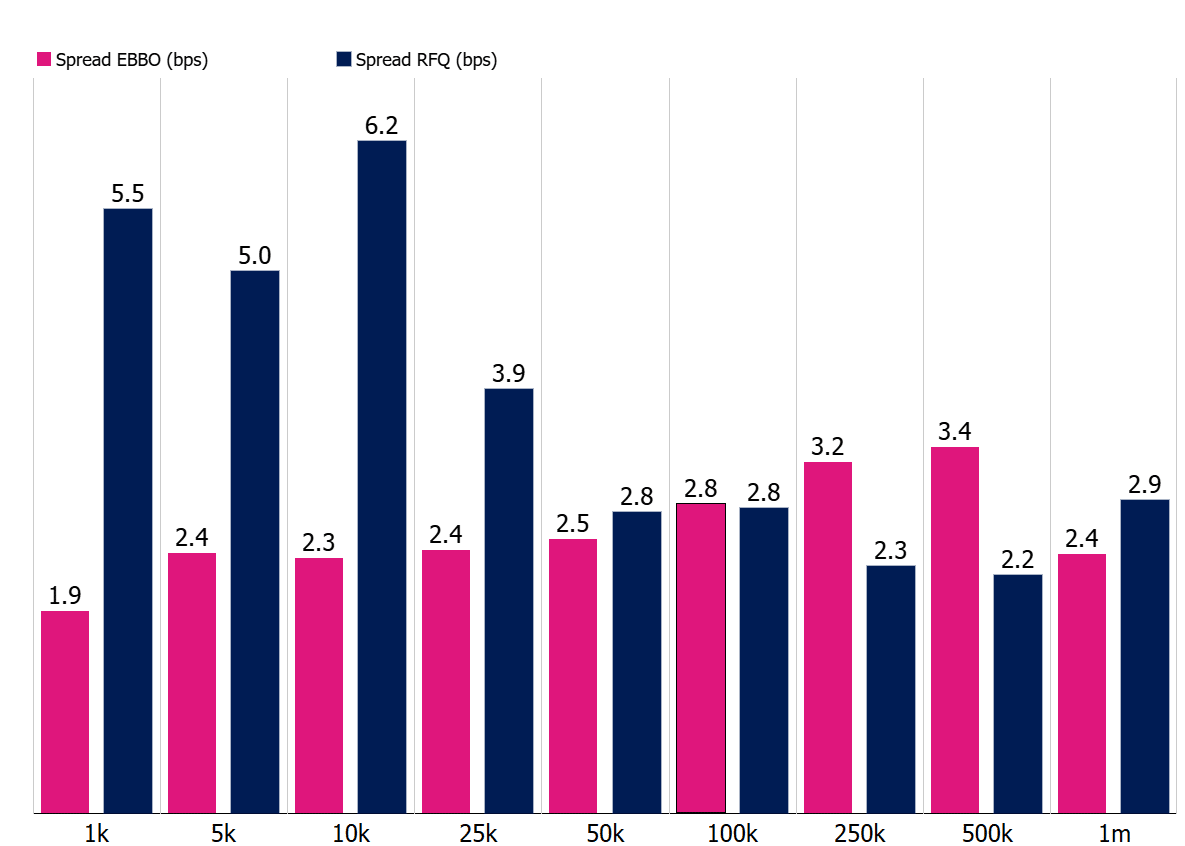
This chart presents a side-by-side comparison of RFQ and EBBO spreads, in basis points, for the iShares € High Yield Corporate Bond UCITS ETF (IHYG). It illustrates how spread dynamics differ for a fixed income ETF, where liquidity and pricing transparency tend to be more variable.
Implications for Market Participants
As RFQ platforms become more accessible to a broader range of users and trade sizes, transparency around execution quality is critical. Investors may assume they are getting institutional-grade pricing regardless of size or venue, but the data tells a more nuanced story.
For investors, this underscores the importance of understanding where and how ETF trades are executed. For issuers, it highlights the need to provide clear guidance and structural support to ensure that secondary market liquidity functions are as expected – across all trade sizes.
The Importance of Data-Driven Liquidity Assessment
ETF liquidity is more than headline volumes or average daily spreads. It requires a granular understanding of trade dynamics, venue behaviour, and pricing patterns. As more pre-trade transparency becomes available and trade reporting improves, market participants should take advantage of these insights to inform their strategies.
In short: European ETF liquidity is evolving, and participants must evolve with it – armed with better data, smarter analytics and greater awareness of how spreads behave in real-world trading scenarios.