
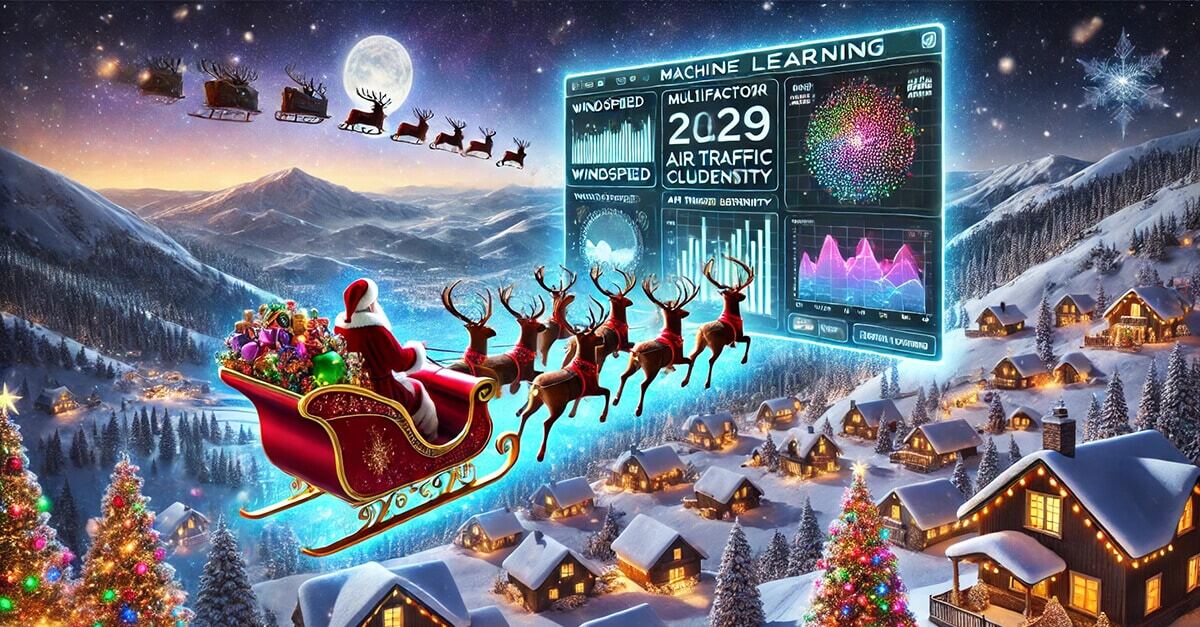
In present delivery, timing is everything. Santa has to stay exactly on schedule. Too fast and you risk a Christmas Eve delivery* or even being spotted. Too slow and the children are already awake and the sprouts are on. Or worst of all, there are a few presents left in the sleigh on Boxing Day. Taking into account timezones and population densities, windspeed, air traffic conditions and the dispersion of nice and naughty children (and grown ups), it’s a complicated business. These factors are highly dynamic, changing in real time and they affect one another.
Sound familiar? Well it’s just the same as guiding the execution of a big order through the trading day to match liquidity. Predicting the volume curve depends on detailed analysis of the factors affecting the distribution of liquidity over time with the chief event being the Closing Auction. As the Closing Auction may be several hours away, an accurate curve forecast is essential to knowing when to start trading and at what speed to trade. We must use recent historical patterns and constantly update our predictions in real time.
At big xyt we use Machine Learning techniques to study these factors for the calibration of our intraday streaming curves as shown in the screen shot below which was taken a short time ago. It depicts a large trade in Vodafone using today’s volume pattern. The ML helps us to identify and weight characteristics such as the volume traded on the lit order book and other venue types, general market volumes and the index. Ongoing research implies some tantalising correlations between Closing volumes and large intraday prints which our customers can explore using our xyt Lab service.
Chart 1 and 2
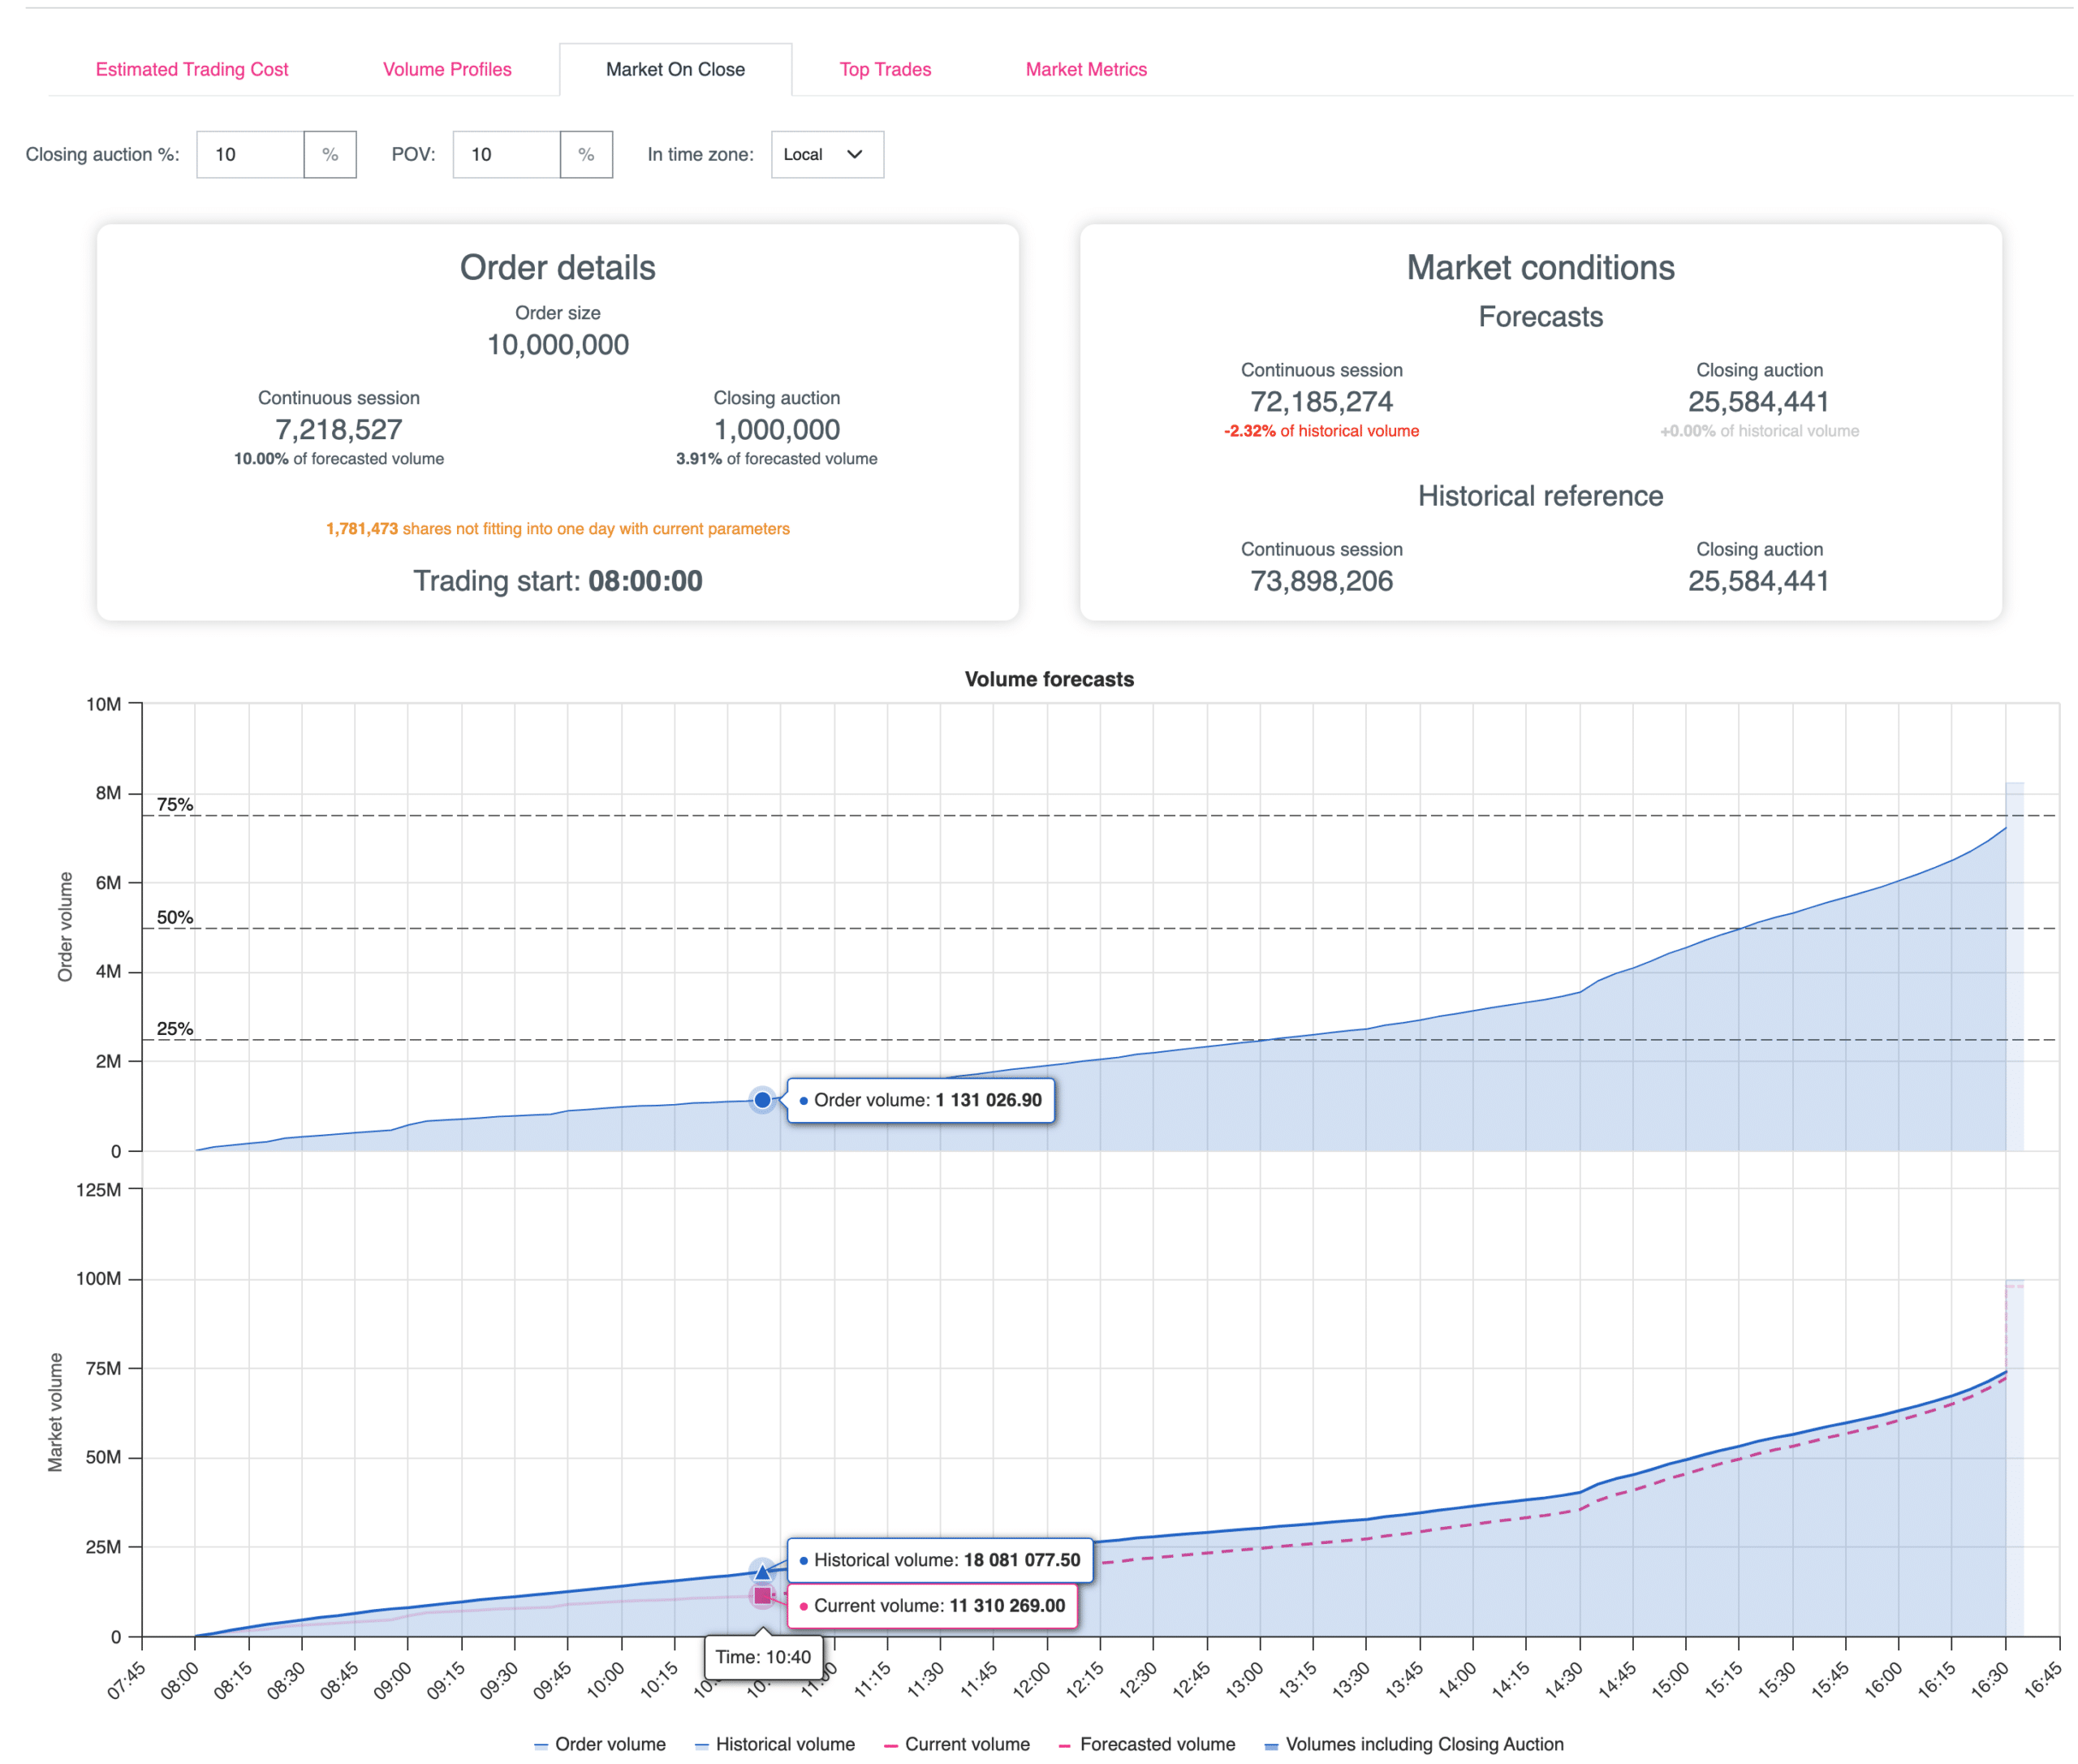
Traders can model the participation rates in both the Continuous period and Closing Auction by adjusting the parameters and allowing them to monitor forecast residuals. Chart 1 shows the expected trajectory of our Vodafone example, while Chart 2 shows the historical volume curve (blue line) and today’s actual volume curve (red line), where the dashed segment represents the forecast over the remainder of the day and in the Close Auction. Other screens in the tool allow modelling of expected market impact and exposure to volatility and distribution across venues and venue types.
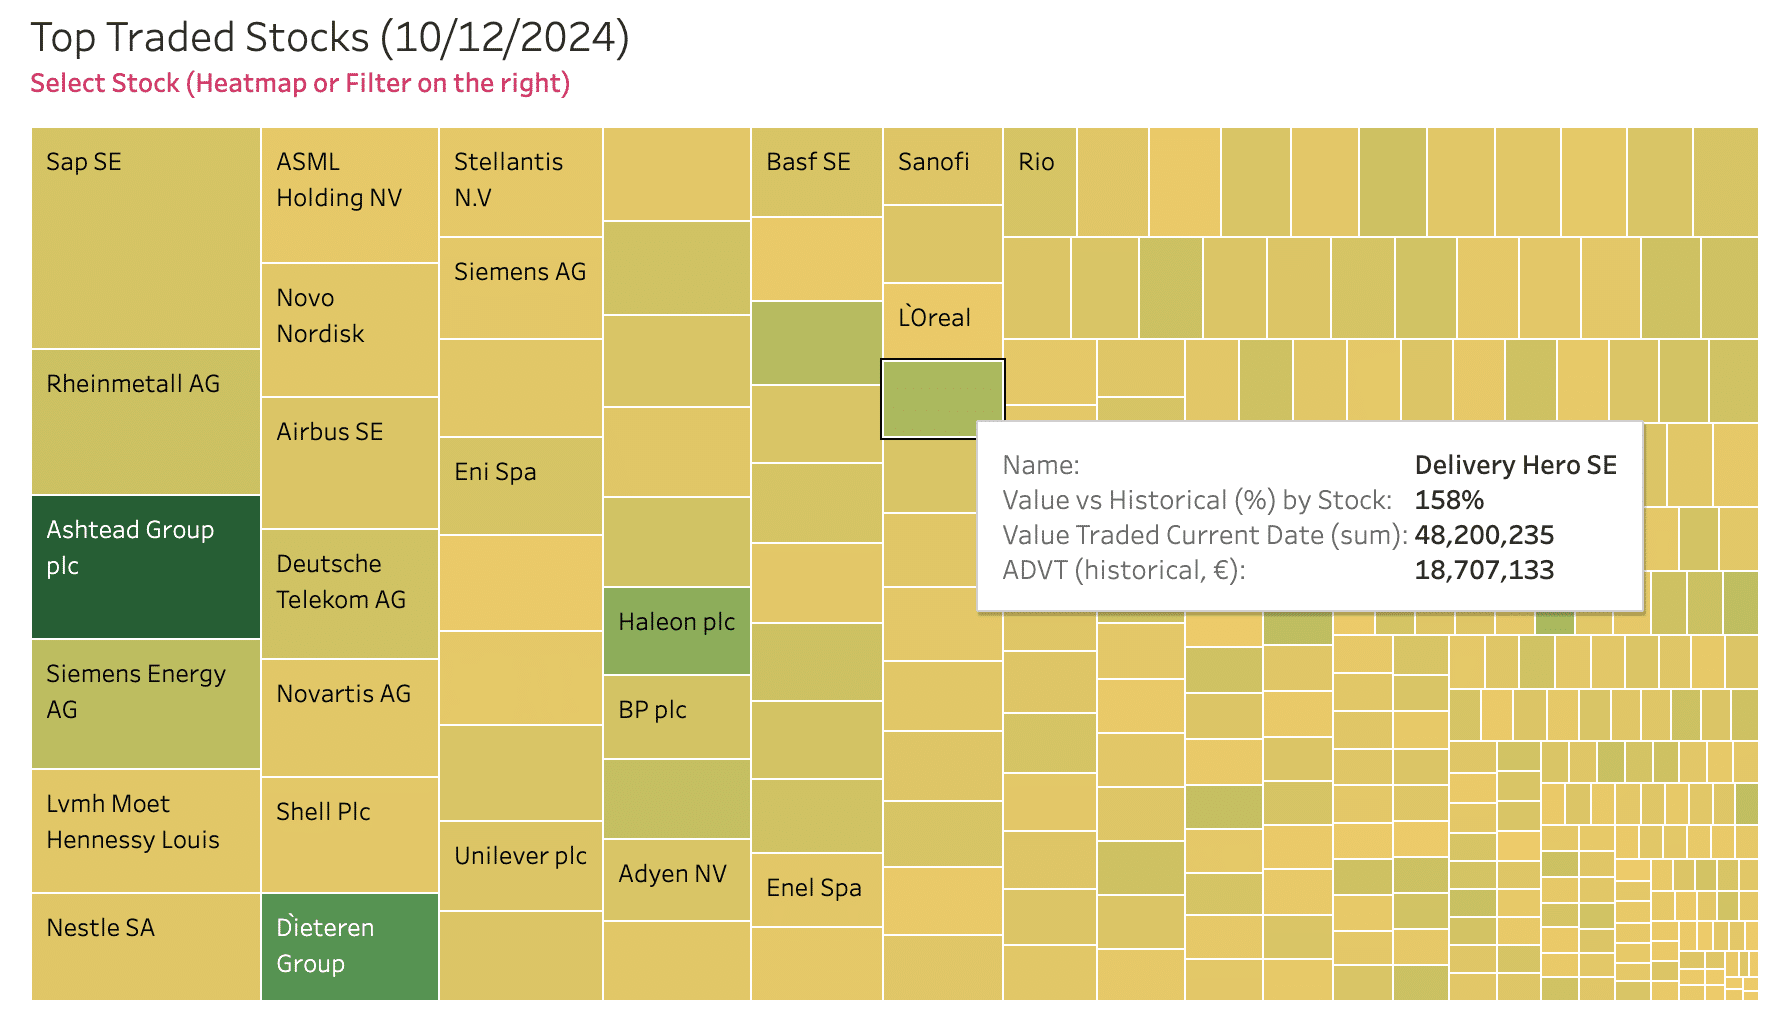
For those of us in the northern hemisphere who are approaching the winter solstice we thought a nice heatmap would be useful to ward off the cold, and one that fully complements our volume curve forecasting tools. This one shows which symbols are trading at substantially higher or lower levels than their recent historical pattern, with those coloured green being greater than 100% and yellow being less than 100%. The user can dig into the details by venue, venue type, index, country and many other dimensions, with matching volume curves depending on the selected dimension.
Heatmap
*Editors Note: we are aware that in many countries Santa visits earlier than calendar Christmas Day and even as early as December 5th, which must also be taken account in Santa’s pre-sleigh modelling.
****
All the content here has been generated by big xyt’s Open TCA dashboards or API.
For existing clients – Log in to Open TCA.
For everyone else – Please use this link to register your interest in Open TCA.