
Of course, Santa has plenty of friends and it looks like some people in the market have some pals in Prague as the dark caps are looking to be relaxed (if not abolished) under the Czech presidency. The restrictions around Systematic Internaliser trading could also be eased.
Given the proposed changes mentioned this week, we take a look at how DVC and SI activity has changed over time, which may help us anticipate what to expect next.
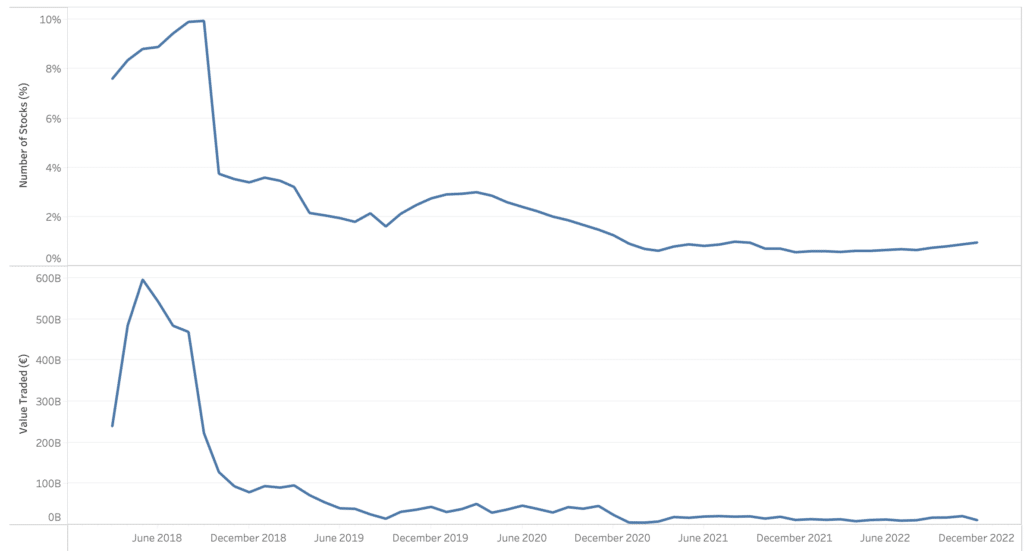
The first two charts show what has happened to trading since the double volume cap regime was introduced in early 2018. The first is the number of stocks affected by the caps shown as a percentage, the second chart shows the same by value.
Both confirm that regulatory change results in a period of adaptation for everyone, but after that, the market tends to stabilise as the participants learn to adapt to the rules.
As we saw in yesterday’s post, SI prints can be identified after hours, often matching the official closing price. For today’s view it is more relevant to see the SI activity during continuous trading.
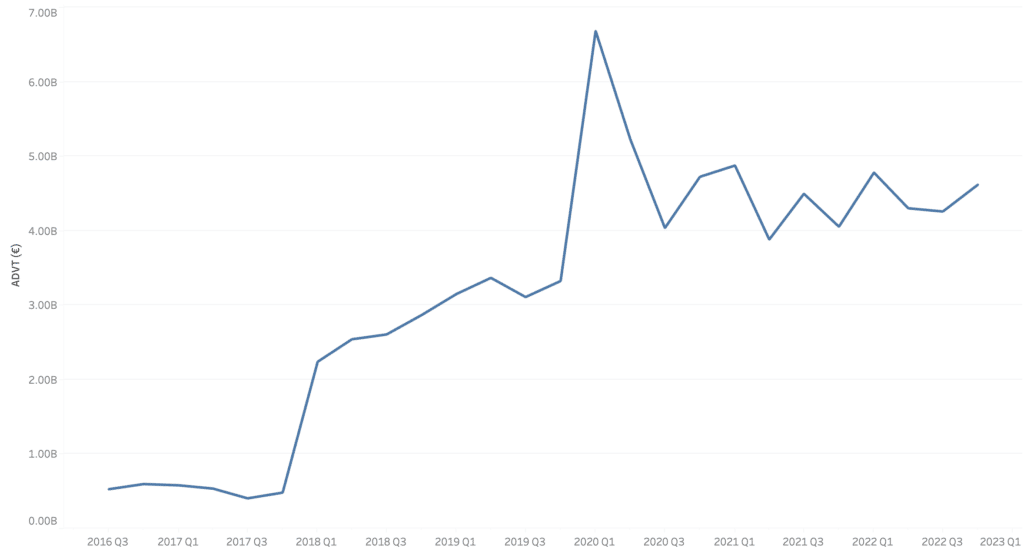
The next chart looks at average daily SI volumes since 2016 (below Large In Scale, using our adjustment as a proxy for ELP SI flow). Again, we see significant growth during and following the period of regulatory change, followed by an increasingly stable pattern.
 In anticipation of SI’s matching more at midpoint across size thresholds (something we can already identify), the final chart zooms into the UK market and shows where sub LIS SI trades are printing versus the PBBO (again during the continuous session) over the last two years.
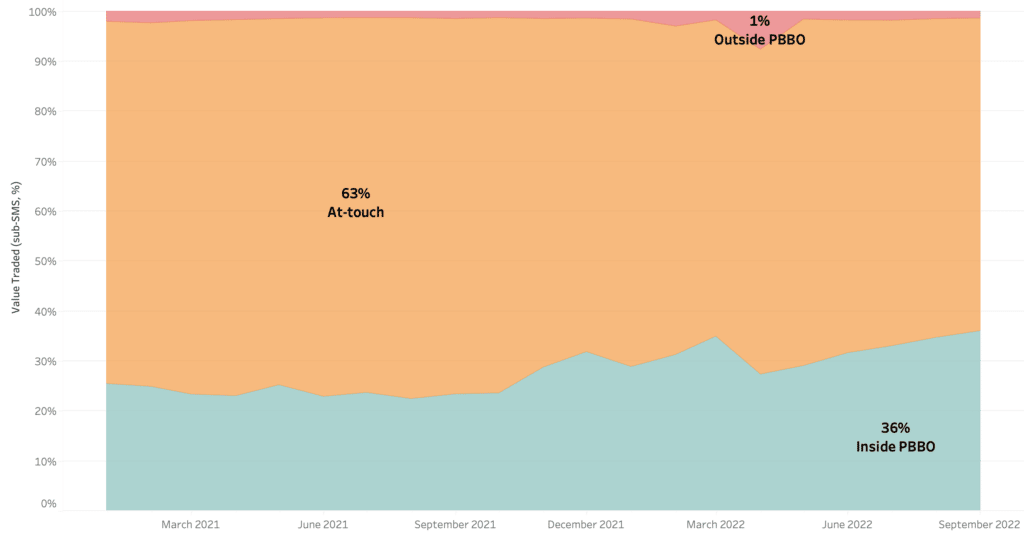
There is a trend here also, as we observe the prints inside the PBBO increasing from around 25% of the total to 36%.
Is the market preparing for a move to midpoint?
All the team at big xyt focus their energy on creating practical tools based on the most granular tick data sets, to enable the community to see changes over time and to measure the impact.
That’s why we built views tracking the changes due to double volume caps, systematic internalisers and other changes during and after MiFID II.
Rest assured we will continue to do so, enabling you to be the first to identify what is most relevant for your trading as the market evolves… that is once you have had time to enjoy a mince pie and a glass of sherry, maybe over a game of chess with Santa.
****
All the content here has been generated by big xyt’s Liquidity Cockpit dashboards or API.
For existing clients – Log in to the Liquidity Cockpit.
For everyone else – Please use this link to register your interest in the Liquidity Cockpit.