
We should be careful with three letter acronyms (TLAs) especially at this time of year when ELFs should not be confused with ELPs. Along with the bank SIs, ELPs deliver a service not dissimilar to Santa’s little helpers – mysterious, fast moving, hard to spot with the naked eye. Undoubtedly hard working and always available, they often deliver nice surprises of various sizes.
Over the last three years, our data scientists have helped us to develop a much better understanding of what is happening in SI land and each year we unwrap a little more.
As many in the community have already seen, we have deployed logic to remove the non-price forming and most of the non-addressable trades reported to show our “adjusted” view.
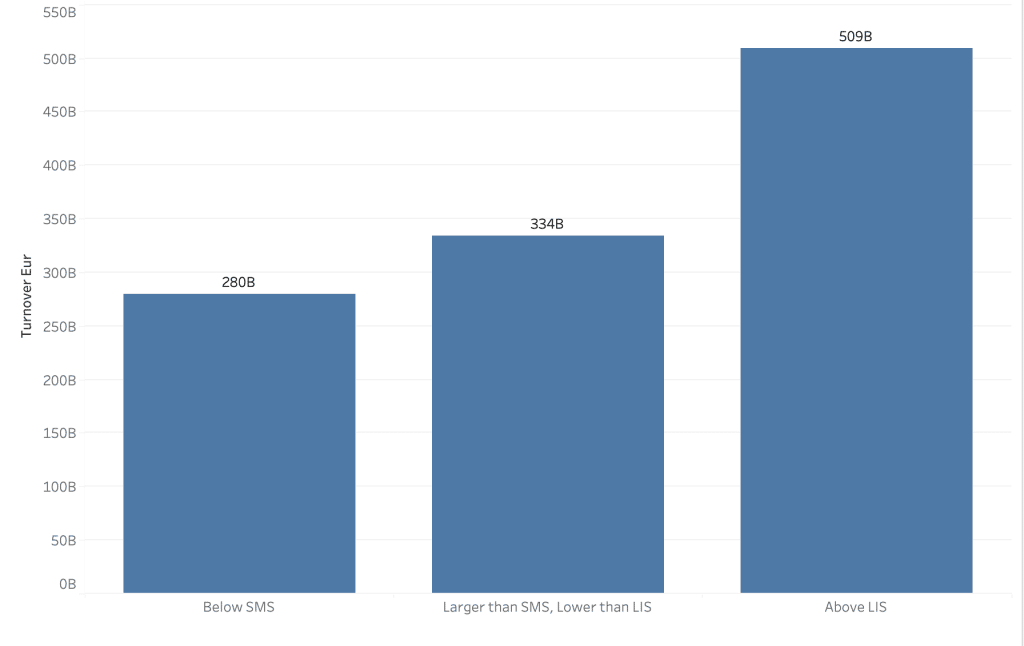
Our most recent work in this area has been to break this SI flow down into other segments of interest, firstly trade size. The examples here use a universe of the 640 most traded stocks in Europe including EEA, UK and Swiss names. In the 11 months to November this year our team calculated that of the total traded volumes reported by SIs (adjusted for clearly non pricing forming trades and inside the continuous trading session), €280B was SMS, €335B above SMS and below LIS, and €510B above LIS.
Given the recent guidance from the European Commission where they proposed no midpoint trading on SIs where quotes were less than 2 x SMS, we decided to examine where that trading was taking place compared to the primary best bid offer (touch prices) during 2021.
The next chart shows where SIs are trading in that smallest segment of SMS or below representing 25% of SI activity.
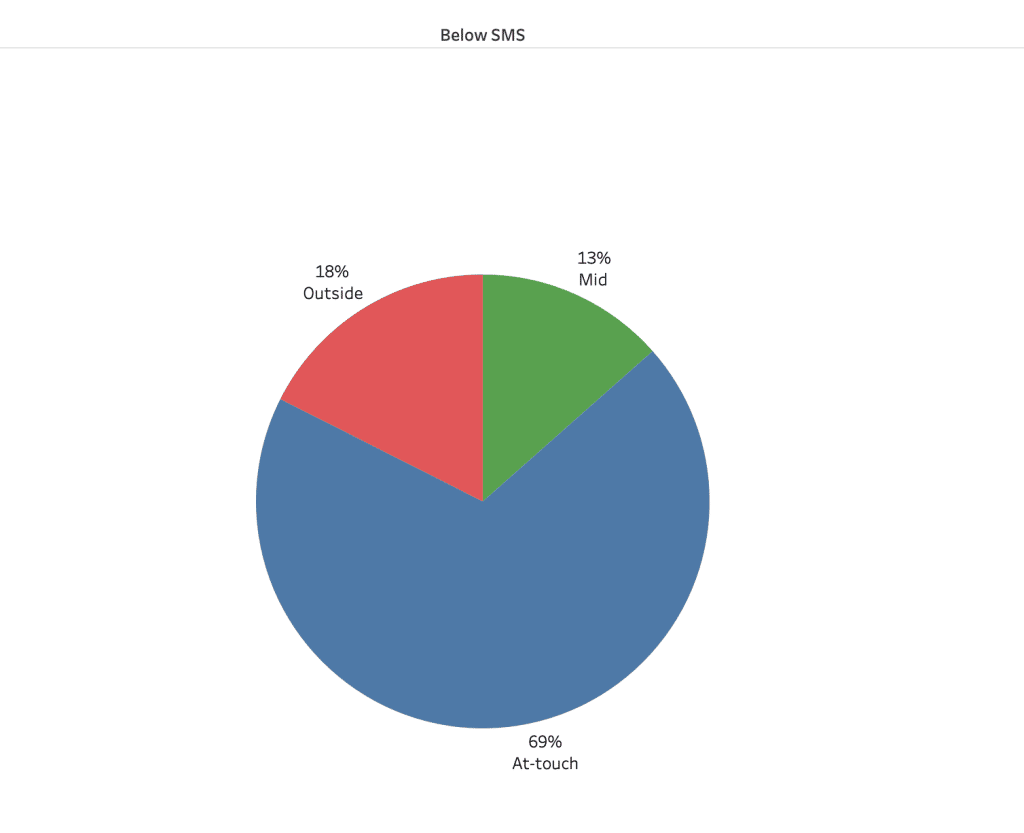
13% of the traded value is at the midpoint, 69% is at or within the primary touch price (but not at mid) and 18% is outside the PBBO.
Let’s take a look at the same distribution for SI trades between SMS and LIS representing 30% of SI trading during market hours.
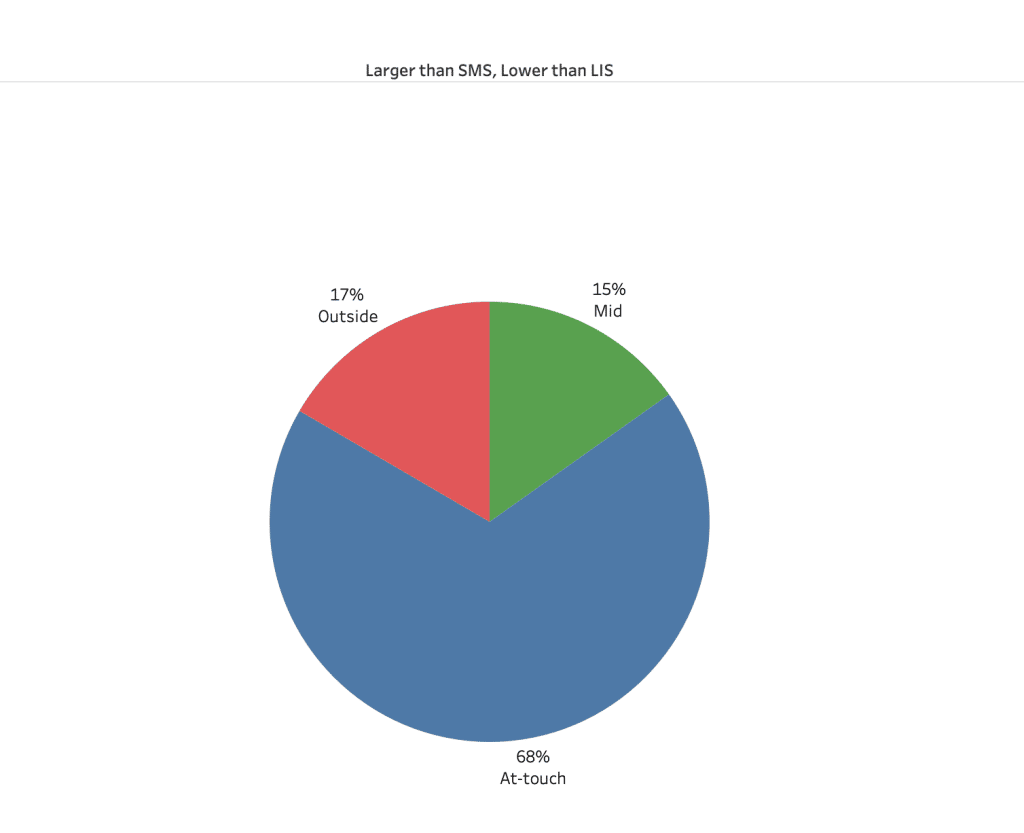
As you can see the split is very similar.
To complete the picture, the final pie represents the 45% of SI activity that is at or above LIS thresholds.
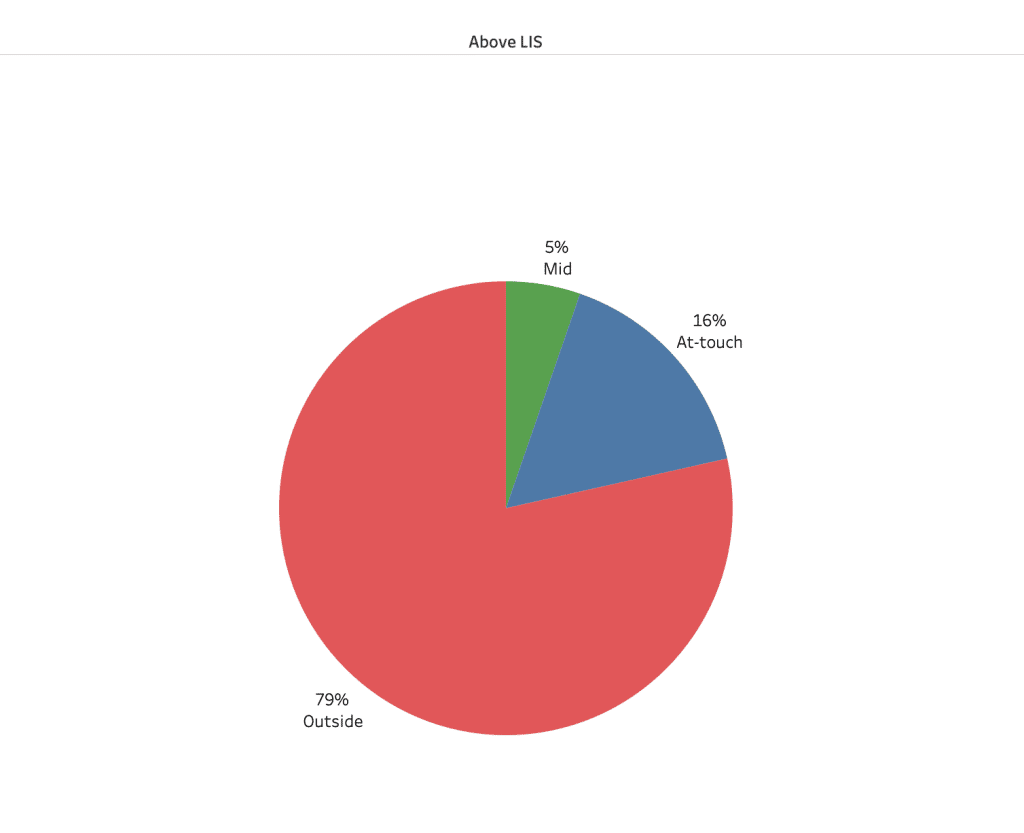
Not surprisingly, given the additional risk provision, a different picture emerges. Just 5% at the mid, 16% at or within the touch, and the balance, 79% of LIS SI prints are outside of the PBBO.
SI land may seem like an invisible world, but with smart analytics it is possible to take a peek inside….unless you have something elf better to do.
Incidentally, through execution analysis, we can see right through to the identity of the trading firm, but as this is not public, you need to be a client to reap the benefits of this level of transparency and granularity.
****
All the content here has been generated by big xyt’s Liquidity Cockpit dashboards or API.
For existing clients – Log in to the Liquidity Cockpit.
For everyone else – Please use this link to register your interest in the Liquidity Cockpit.
Oh and one last thing: We’ve been nominated in the A-Team’s TradingTech Insight Awards Europe 2022, in the Best Transaction Cost Analysis (TCA) Tool and the Best Trading Analytics Platform categories. Please vote for us here.