

Yesterday we commented on closing auction volumes, which are, of course, composed of multiple trades in a stock at the same time and price – perhaps familiar to those of you who like to combine several presents together in one piece of wrapping paper. When it comes to a single large present it is always nicer when it comes as a surprise. Away from the auctions, most institutional traders target dark pools as an efficient way to shift large positions. With no guarantee of trading, most of these dark trading venues bring the advantage of mid-point pricing. Benefits include saving half the spread as well as reducing the information leaked when interacting with a public order book.
So let’s take a look at the largest dark trades in Europe this year.
The first chart is only showing Large In Scale (LIS) trades on European dark venues (the colours indicate different venues) during 2021, and we have filtered out those below €40M. We can observe that these large dark trades are occurring regularly, however unlike the auctions, the peak size has not been increasing and appears to have something of a ceiling. This is probably explained by the fact that dark trades almost always take place between two, rather than multiple, parties. Furthermore it is extremely rare to see two investors wanting to respectively buy and sell a stock in a huge size without some human intervention.
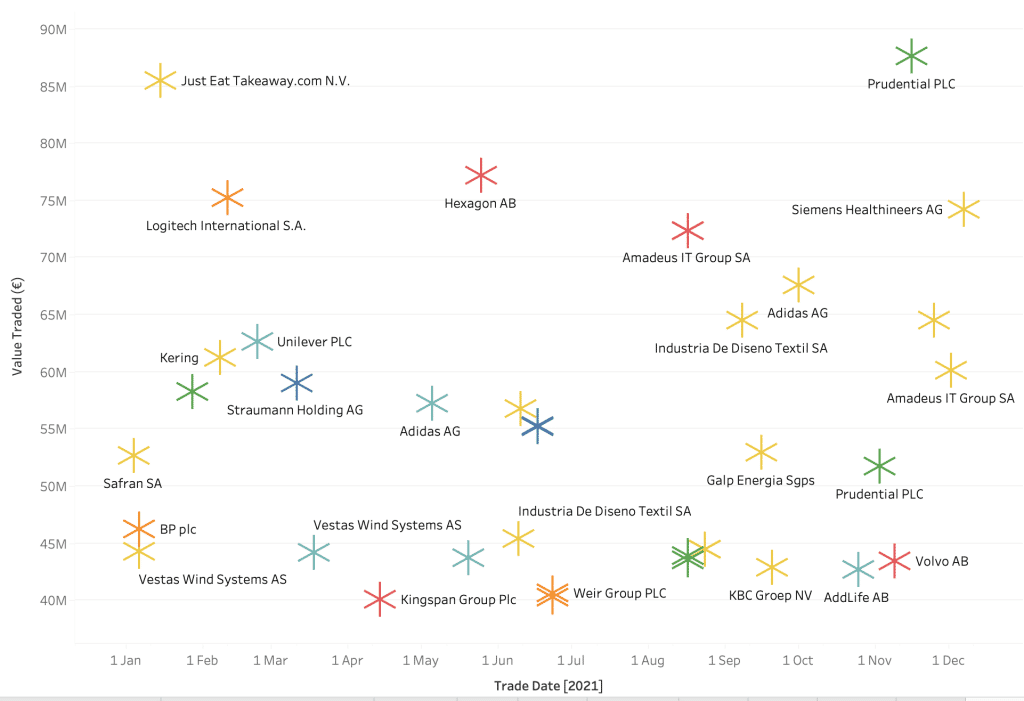
It could be interesting to investigate If there is a natural threshold and this might depend on, amongst other factors, average liquidity in a stock or indeed the market capitalisation.
We have seen how initial trades in dark pools often act as a catalyst for further activity in a stock. The second chart shows the cumulative daily volume by stock in dark pools. Each data point represents more than €100M of value traded on a given day across all dark pools (left y-axes). The size of the datapoint represents the number of the 14 dark pools in Europe contributing to the aggregated trading on that day. We see here (the background line shows the 20-day average of total daily LIS trading, right y-axes) that overall volumes in dark trading are quite volatile but not actually increasing that much in aggregate.
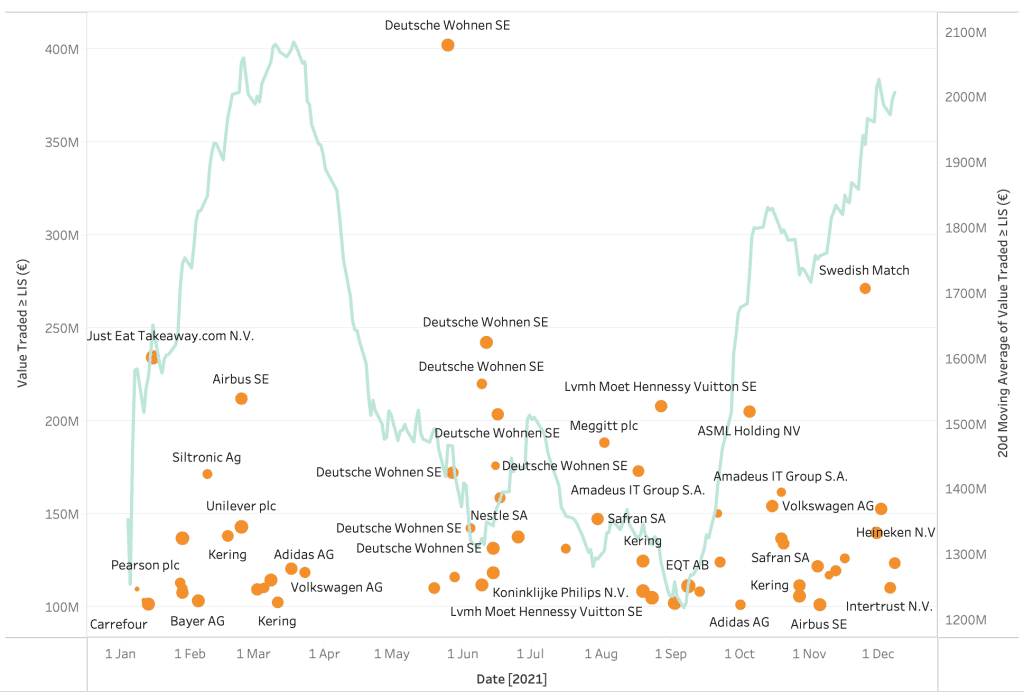
What we have identified separately is that different segments of different markets appear to see more dark trading than others and this has been recently amplified by the polarisation of the regulators’ stance post-Brexit. More on this to follow, or take a look at the Liquidity Cockpit views to unwrap additional evidence.
****
All the content here has been generated by big xyt’s Liquidity Cockpit dashboards or API.
For existing clients – Log in to the Liquidity Cockpit.
For everyone else – Please use this link to register your interest in the Liquidity Cockpit.
Oh and one last thing: We’ve been nominated in the A-Team’s TradingTech Insight Awards Europe 2022, in the Best Transaction Cost Analysis (TCA) Tool and the Best Trading Analytics Platform categories. Please vote for us here.