

Fund managers and traders following the S&P 500 Index face a challenge when they frantically throw out the junk to make way for the new kid on the block.
The company that sells fewer than 1% of total vehicles globally finds itself with a valuation equal to the largest nine car manufacturers worldwide.
“How can this be?” you may ask yourselves. Part of the answer in recent weeks is the announcement (on November 16th) that Tesla has at last qualified for inclusion in the S&P 500 from the close of business this Friday 18th December. This has put investors into a spin as passive traders have had to buy the stock to adjust their index weightings whilst reducing many of their other holdings to maintain balance. Meanwhile, active traders don’t know whether to take their profits, buy some more, or close their eyes, cross their fingers, spin around three times and hope the problem goes away when they blink back to life.
At big xyt we leave it to others to look into the fundamentals driving stock valuations. What we enjoy doing is looking at how stocks trade over time.
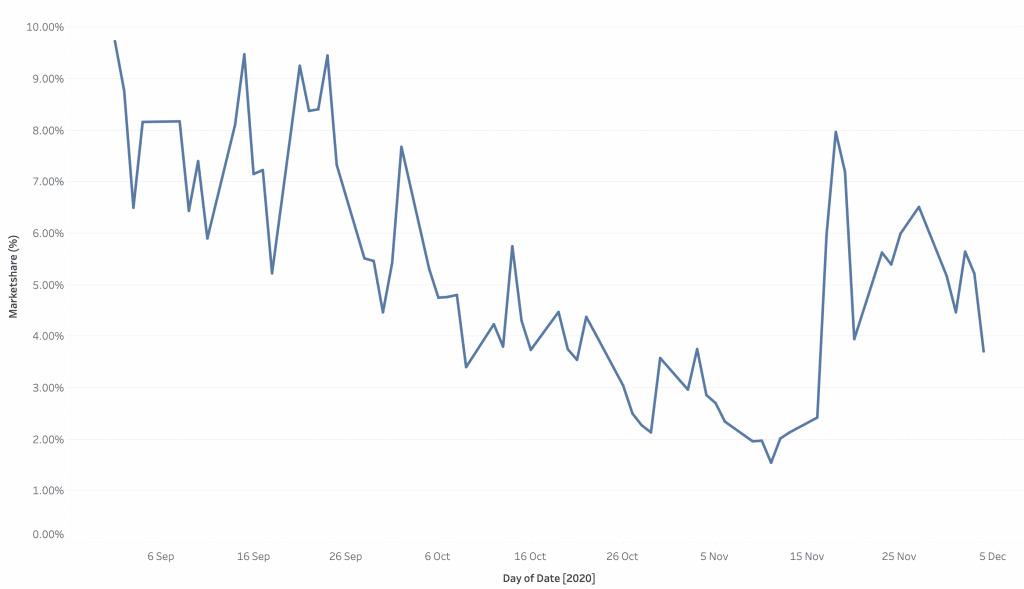
Take a look at our first chart today. This shows the market share of Tesla across the whole US equity market over recent months.
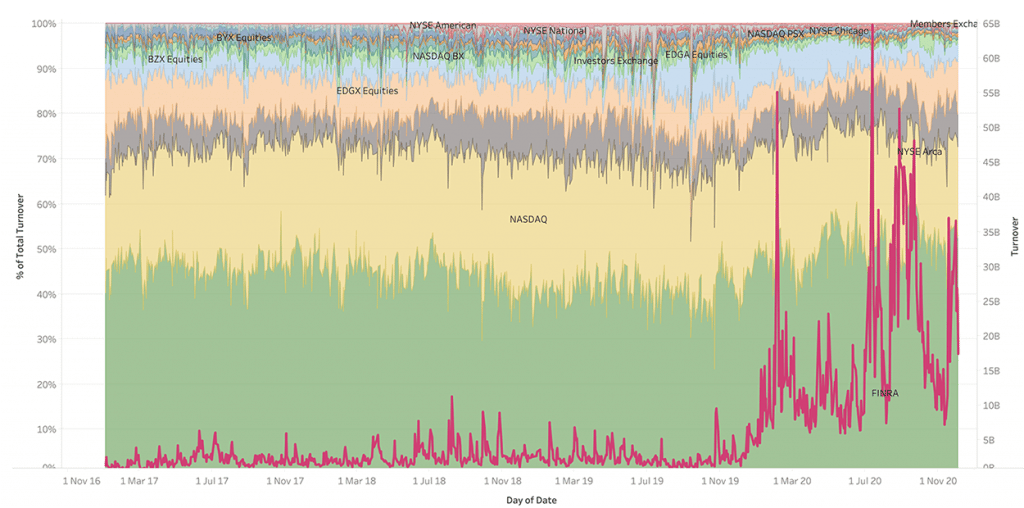
In our second chart we add the complexity of fragmentation. This shows not only how much Tesla trades, but where. The pink line shows the daily value traded against the right hand Y axis. The Battenberg cake in the background shows the fragmentation (market share on the left hand Y axis) across all the venues reporting trades in Tesla. The largest (green) share is the volume reported to Finra.
As with Europe, we can see that the more activity we observe in a stock, the more competition leads to fragmentation… and the more volume is reported in the murky world of OTC/Off book.
Having seen how much it trades and where it trades, our final Tesla chart (for today, at least) shows how it trades on order books.
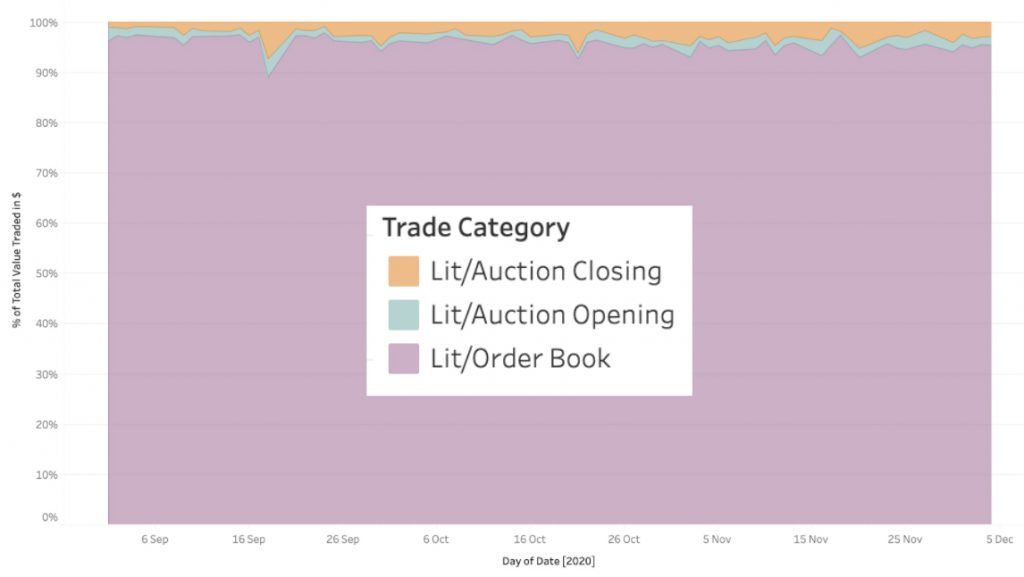
Notably the auction (particularly at the close) represents a much smaller slice than we typically see in Europe, where so much passive trading is benchmarked.
We will be watching to see if Friday is any different. We might be tempted to see if there is any price reversion around the event too.
Either way buckle up, it could be a wild ride.
*****
Please let us know if you are interested in gaining access to this, or other data.
All the content here has been generated by big xyt’s Liquidity Cockpit dashboards or API.
For existing clients – Log in to the Liquidity Cockpit.
For everyone else – Please use this link to register your interest in the Liquidity Cockpit.
Oh and one last thing: We’ve been nominated in the A-Team’s TradingTech Insight Awards Europe for 2020, in the Best Transaction Cost Analysis (TCA) Tool and the Best Trading Analytics Platform categories. Please vote for us here.