
A key topic in the market this year has been whether the trading day should begin later in the morning, a move endorsed by many as a way to concentrate liquidity, especially in the earlier part of the day. We can use the daily volume curves to measure whether the profile of available liquidity is changing over time and so as part of our 12 Days of Trading series we thought we would see if the extremes of 2020 have changed the picture.
One way of thinking about this is by using the time of day when the equity market reaches the 50% and 80% benchmarks for daily cumulative volume. As a rule of thumb, around 50% of order book trading takes place in the last three hours, and 20% in the Closing Auction.
In our first chart below, we show two sample weeks from the UK100 index for on order book trading. The green line shows Week 8 at the end of February, when the crisis resulted in record-breaking highs for total value traded; the 50% benchmark was reached by 13:10 (UK time) and the 80% benchmark by 15:35. At the other end of the scale, the red line shows Week 35 in August, when the market set a record-breaking low for value traded; it took until 13:50 to reach the 50% benchmark, and until 16:05 for 80%. All other weeks of the year lie between these two extremes.
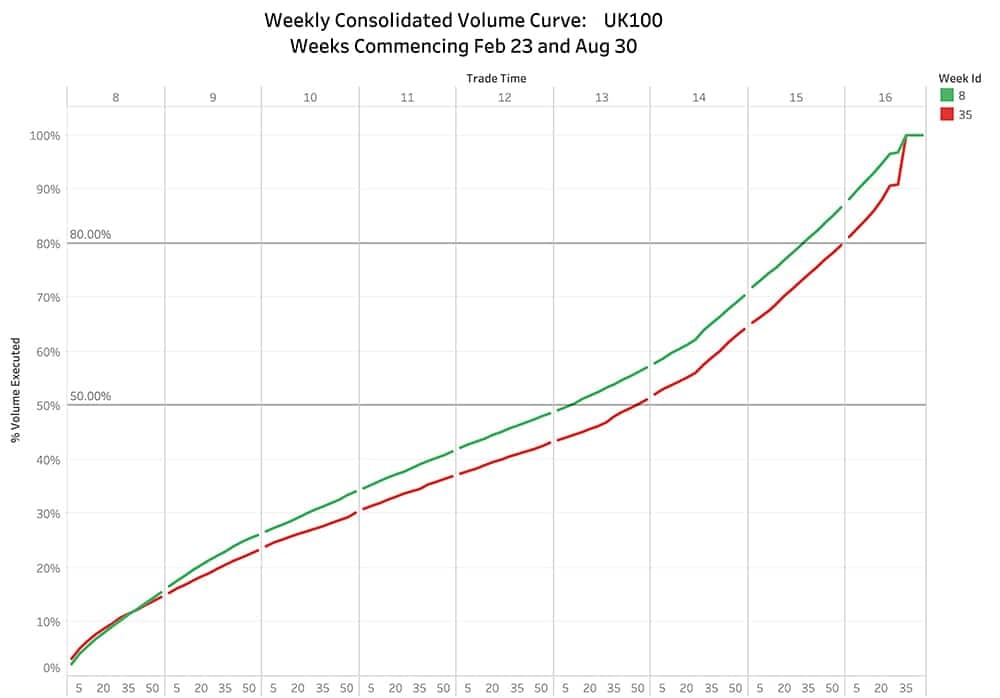
The key takeaway is that the volume profiles in 2020 seem to have behaved in line with the principle that the lower the volume, the greater the skew towards the end of the day, a familiar pattern to prior years. It is notable though that 2020 is the first time in at least five years in which Auction traded value has not grown as a proportion of overall volume.
Of course, there are many minute variations, between indexes, sectors, individual names, and between types of venue, with a large range in the time that the 50% benchmark is reached. For example, Dark trading is more linear than the overall market, with the halfway mark being reached by between 12:15 and 12:45. Read our previous blog on Liquidity Intelligence, to see how volume data is very useful in building an expectation of how quickly you might find a trade of a certain size in any type of venue, including conditionals.
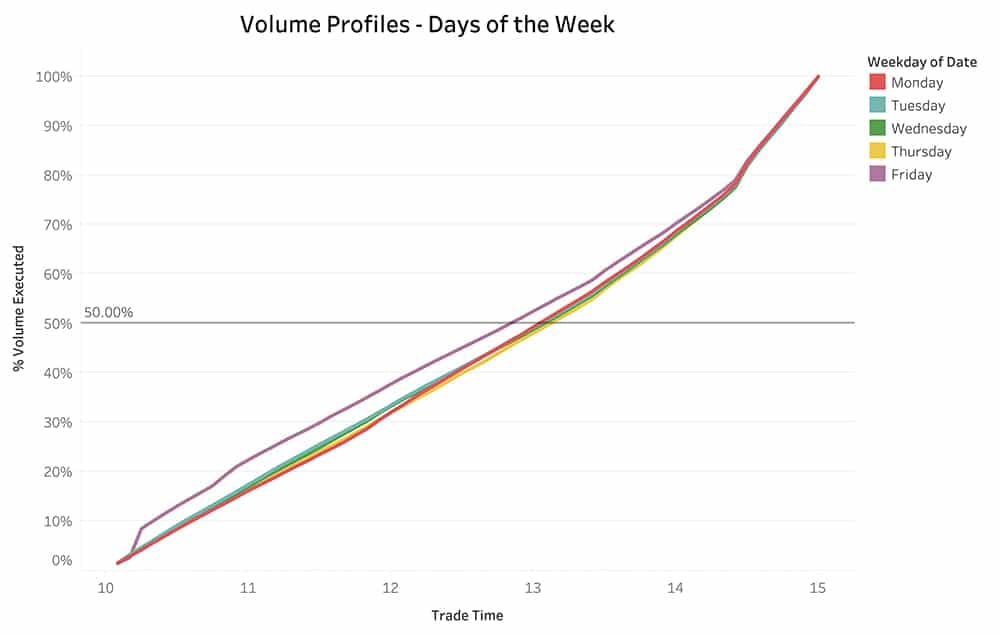
There are even some notable differences between days of the week. As shown in our second chart on the FTSE100, Fridays tend to get to the 50% mark 10 minutes before Thursdays (in this case mostly because of the effect of the monthly futures expiry.)
This year, we added Volume Profiles to our liquidity cockpit which through the API gives you access to curves which are updated daily and that you can customise for a wide range of time periods, types of trading venue and types of trading day such as expiries.
Please let us know if you are interested in gaining access to this, or other data.
All the content here has been generated by big xyt’s Liquidity Cockpit dashboards or API.
For existing clients – Log in to the Liquidity Cockpit.
For everyone else – Please use this link to register your interest in the Liquidity Cockpit.
Oh and one last thing: We’ve been nominated in the A-Team’s TradingTech Insight Awards Europe for 2020, in the Best Transaction Cost Analysis (TCA) Tool and the Best Trading Analytics Platform categories. Please vote for us here.