

book a demo member login
XYT_LOGO_LIGHT_RGB
Solutions
Market Intelligence
Liquidity, market share and market quality - how your names really trade.
Transaction Cost Analysis
Performance on the SMART benchmark, against the market that actually traded.
Pre-trade modelling
Know the cost before you send it - modelled on the addressable core.
Datashop - Data & APIs
Analysis-ready datasets, on your schedule, in your format.
xyt AI
Ask in plain English - transparent answers on the same trusted record.
✦ New
xyt AI
Ask xyt in plain English, or plug xyt into your own AI - compatible with any model.
Discover xyt AI →
Across Equities · ETFs · Listed derivatives · FX · Fixed income Real-time + historical · 120+ venues · 10 yrs history
Who we serve
ETF Issuers
Liquidity, market-maker oversight, execution quality.
Asset Managers
Mechanism, timing, best execution.
Banks & Brokers
Independent benchmarks for flow.
Market Makers
The issuer lens; price competitively.
Exchanges & Venues
Where flow prints and share moves.
Insights
About
Contact
Contact

12 Days of Trading – Day 11 of 12: easyJet shares hit a snowstorm

22 December 2020
/
big xyt
/
12 Days of Trading 2020
/
Views

big xyt

It’s been a turbulent year for the airlines, and just as the arrival of vaccines seemed to clear away some of the clouds, they’ve been hit by a blizzard of travel restrictions.  In today’s 12 Days of Trading post we look at easyJet, a UK travel sector mid cap stock, as an example of how liquidity analysis can inform trading tactics during times of volatility.

easyJet’s shares seemed to be on a smooth climb out just a few weeks ago before suffering a 13% price drop over the weekend, most of which has been recovered at the time of writing.

Today’s chart shows the shares’ flightpath over the last few weeks, and puts yesterday’s sell off into context.  Sterling value traded increased around 60% over the 20-day average, while spreads also increased by 60% from 9 to 15bps.
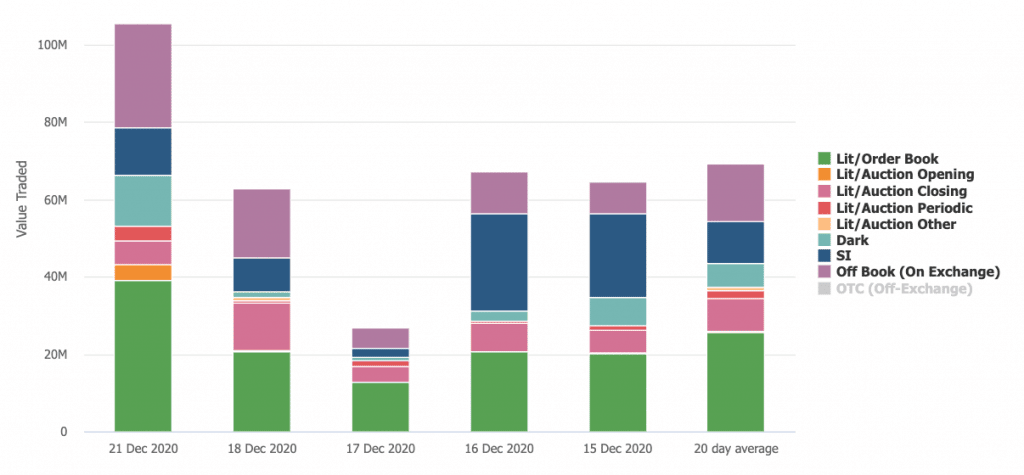
We can see the pattern of trading diverging from market norms; 4% traded in the Open (orange) compared with an expected 1.5%, and reflecting the weekend gap, 4% traded in periodic auctions (red) compared with the usual 2.5% and dark trading (light blue) doubled to 12%.  On such a busy day, the data tells us to expect more trading on the lit order books, outside of the auctions, but this did not materialise.  It seems to have been a day for maximising dark pools and alternative methods such as periodics.

While this event may not grab the headlines as much as say the recent behaviour of Tesla shares, we wanted to show you the importance of keeping an eye on the details.  We see time and again that mid cap shares do not follow the average patterns of the market as a whole, perhaps reflecting that there is more manual trading activity in these names especially at times of stress – and we see this in elevated block trading in easyJet yesterday.

In our Single Stock Analytics tool, you can follow the patterns of evolving liquidity at the level of individual shares and on a daily basis.  You can use the information to help inform how you execute your trades, especially if you are a significant portion of ADV.

*****

Please let us know if you are interested in gaining access to this, or other data.

All the content here has been generated by big xyt’s Liquidity Cockpit dashboards or API.

For existing clients – Log in to the Liquidity Cockpit.

For everyone else – Please use this link to register your interest in the Liquidity Cockpit.

Oh and one last thing: We’ve been nominated in the A-Team’s TradingTech Insight Awards Europe for 2020, in the Best Transaction Cost Analysis (TCA) Tool and the Best Trading Analytics Platform categories. Please vote for us here.


Something Powerful

Tell The Reader More

The headline and subheader tells us what you're offering, and the form header closes the deal. Over here you can explain why your offer is so great it's worth filling out a form for.

Remember:

  • Bullets are great
  • For spelling out benefits and
  • Turning visitors into leads.

Related Insights

15 July 2025

Modernising Market Transparency: Our Understanding of the FCA Consultation Paper CP25/20

The UK Financial Conduct Authority’s (FCA) July 2025 Consultation Paper CP25/20 marks a notable moment in the evolution …

Modernising Market Transparency: Our Understanding of the FCA Consultation Paper CP25/20

08 July 2025

The Finance Hive’s CMX 2025: What Multi-Asset Buy-Side Desks Need from TCA

At The Finance Hive’s CMX 2025, our TCA workshop focused on how trading desks are adapting their daily workflows – using…

The Finance Hive’s CMX 2025: What Multi-Asset Buy-Side Desks Need from TCA

04 June 2025

Scaling European Equity and ETF Data Processing To Deliver the Consolidated Tape

Laying the technological and operational foundation is essential for the European Consolidated Tape (CT). Our infrastruc…

Scaling European Equity and ETF Data Processing To Deliver the Consolidated Tape
pieArtboard 24 1

Get in contact with the xyt team to learn more.

Contact us
footer-logo
  • Solutions
  • News & Insights
  • Careers
  • About
  • Contact us
  • Support
member login
Follow us
linkin twiter

©2026. All rights reserved.  | Privacy | Imprint