


Episode 7: Dark Pools and Periodic Auctions Matter - Alternative Intraday Liquidity
Dark pools and periodic auctions now collectively account for 16% of daily European addressable liquidity in 2026, just one percentage point behind closing auctions, as the two mechanisms continue to erode market share from lit order books, which have fallen to a ten-year low of under 32%.
The shift marks a dramatic structural change in European equity trading since the introduction of MiFID II/MiFIR in 2018. Combined, dark pools and periodic auctions have more than doubled their footprint relative to on-order-book liquidity, rising from 9% to 24% over that period. This is a near tripling in share that underscores how fundamentally trading behaviour has changed in the post-reform era.
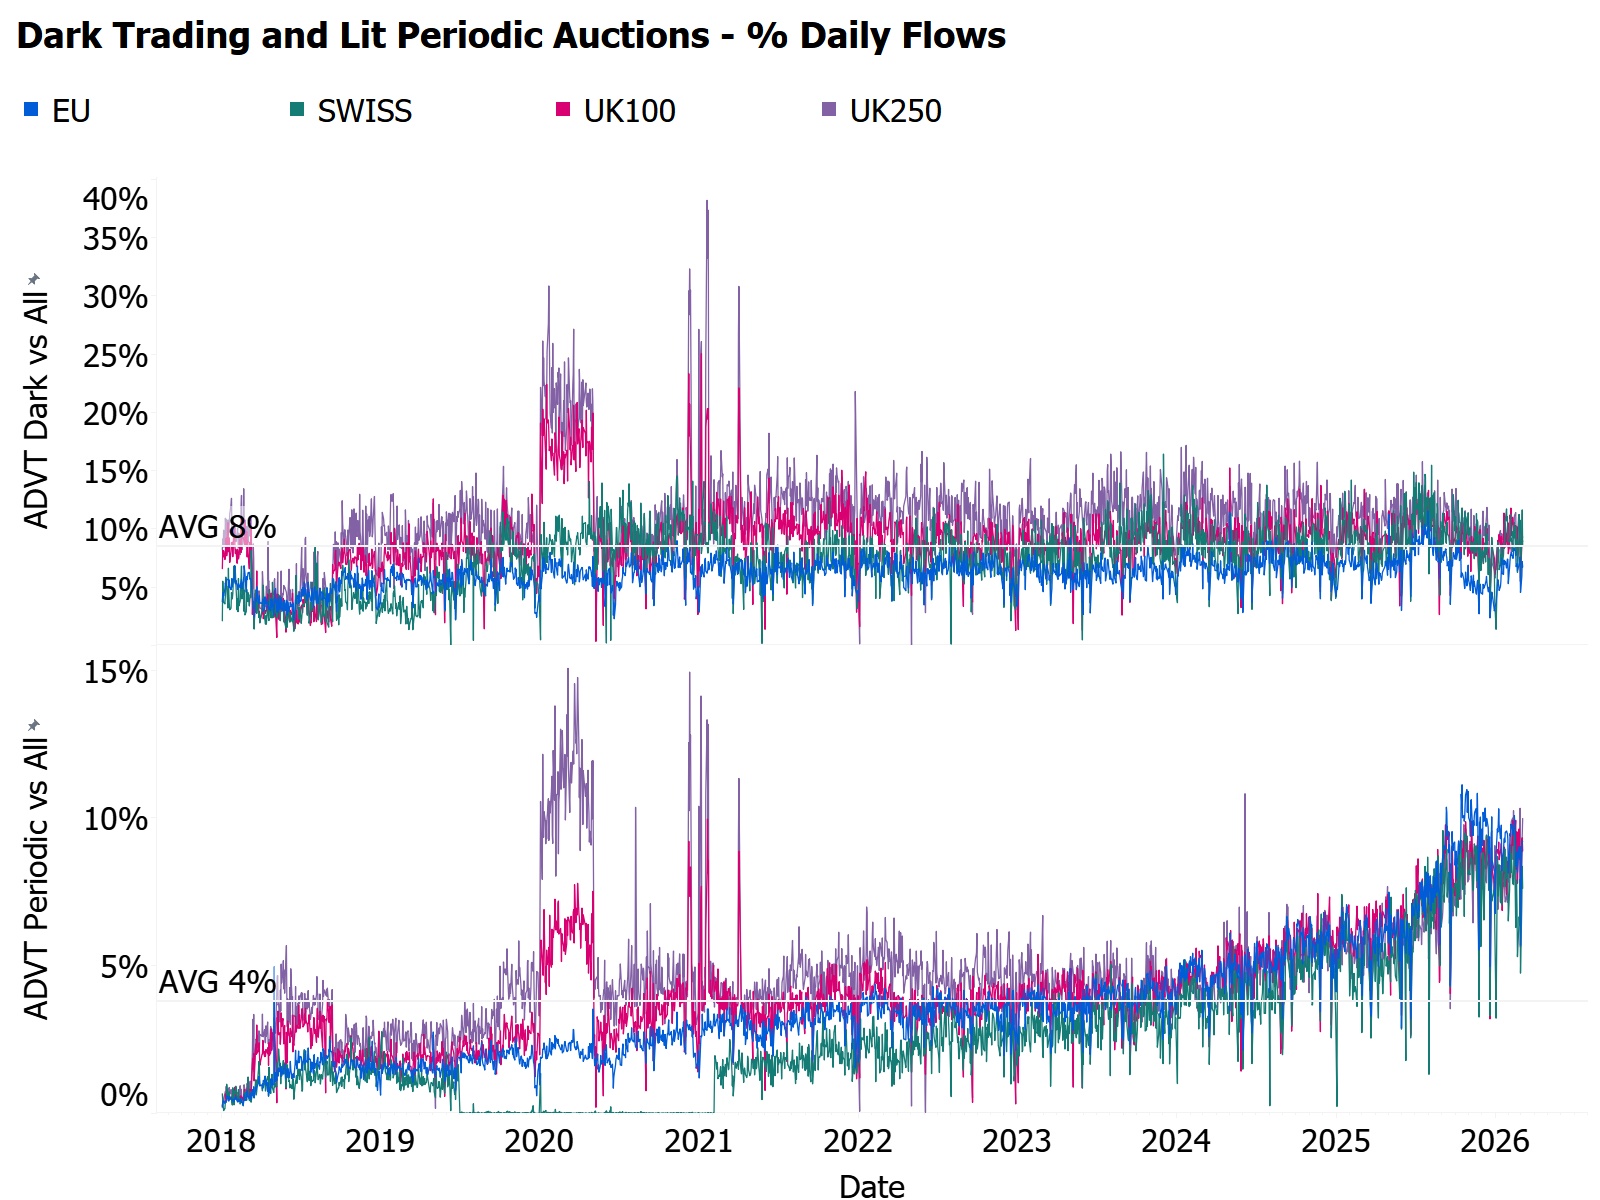
Figure 1: Daily volume traded in UK, Swiss and EU names since MiFIR implementation in Dark Pools and Periodic Auctions
Tracking this shift at the individual stock level is an essential prerequisite for managing intraday trading costs and minimising benchmark tracking error, particularly in the current volatile market environment.
Much attention has rightly been paid to the relentless growth of closing auction liquidity, which has reached €14bn per day in 2026. Yet it is periodic auctions that have emerged as the more dynamic story. Accelerating sharply over the last six months, periodic auctions and dark pools combined have already posted €13bn in daily liquidity so far in 2026, and at the current rate of growth, are on course to surpass the closing auction within the year.
It is this convergence, and the speed at which it is unfolding, that makes venue and liquidity monitoring so critical, and shapes the execution strategies traders need to deploy in order to avoid additional cost in volatile markets.
With trade sizes of up to twice that of the main order books, and showing lower post trade price movement, these venues are a critical source of liquidity for intraday trading, especially for shortfall strategies and aggressive price taking orders. The recent rise of periodic auctions (aka frequent batch auctions) is shown in Figure 1. If you are unfamiliar with the mechanics of these trading venues, some notes are included at the end of this blog.
The effects on the market regime of changing regulation can be dramatic. Figure 1 shows how the implementation of dark caps resulted in over 1,000 names being suspended by 2018, at once - surely a dislocation. The system took a few years to stabilise during which the periodic auctions came of age. The Swiss equivalence reset in 2019 led to a halt in periodic auction trading for 18 months in those names. The FCA dropped the caps altogether following Brexit. UK based names enthusiastically jumped to nearly 15% of daily addressable volume (in the case of the mid caps), before settling back to the only slightly elevated 10% level. The ESMA review implemented lower caps of 7% in October 2025, triggering a fall in the stable level of dark pool trading and a rapid rise in periodic market share.
Geographical and Market Cap Variations
Figure 2: Dark pools only; depicts regional variation: Neither Swiss nor UK regulators restrict trading through caps, and show the highest level of dark pool trading, whereas Italy has the lowest level, mainly due to the local transaction tax which penalises trading away from the lit order book. Differences in local market structure play out in the availability of liquidity.
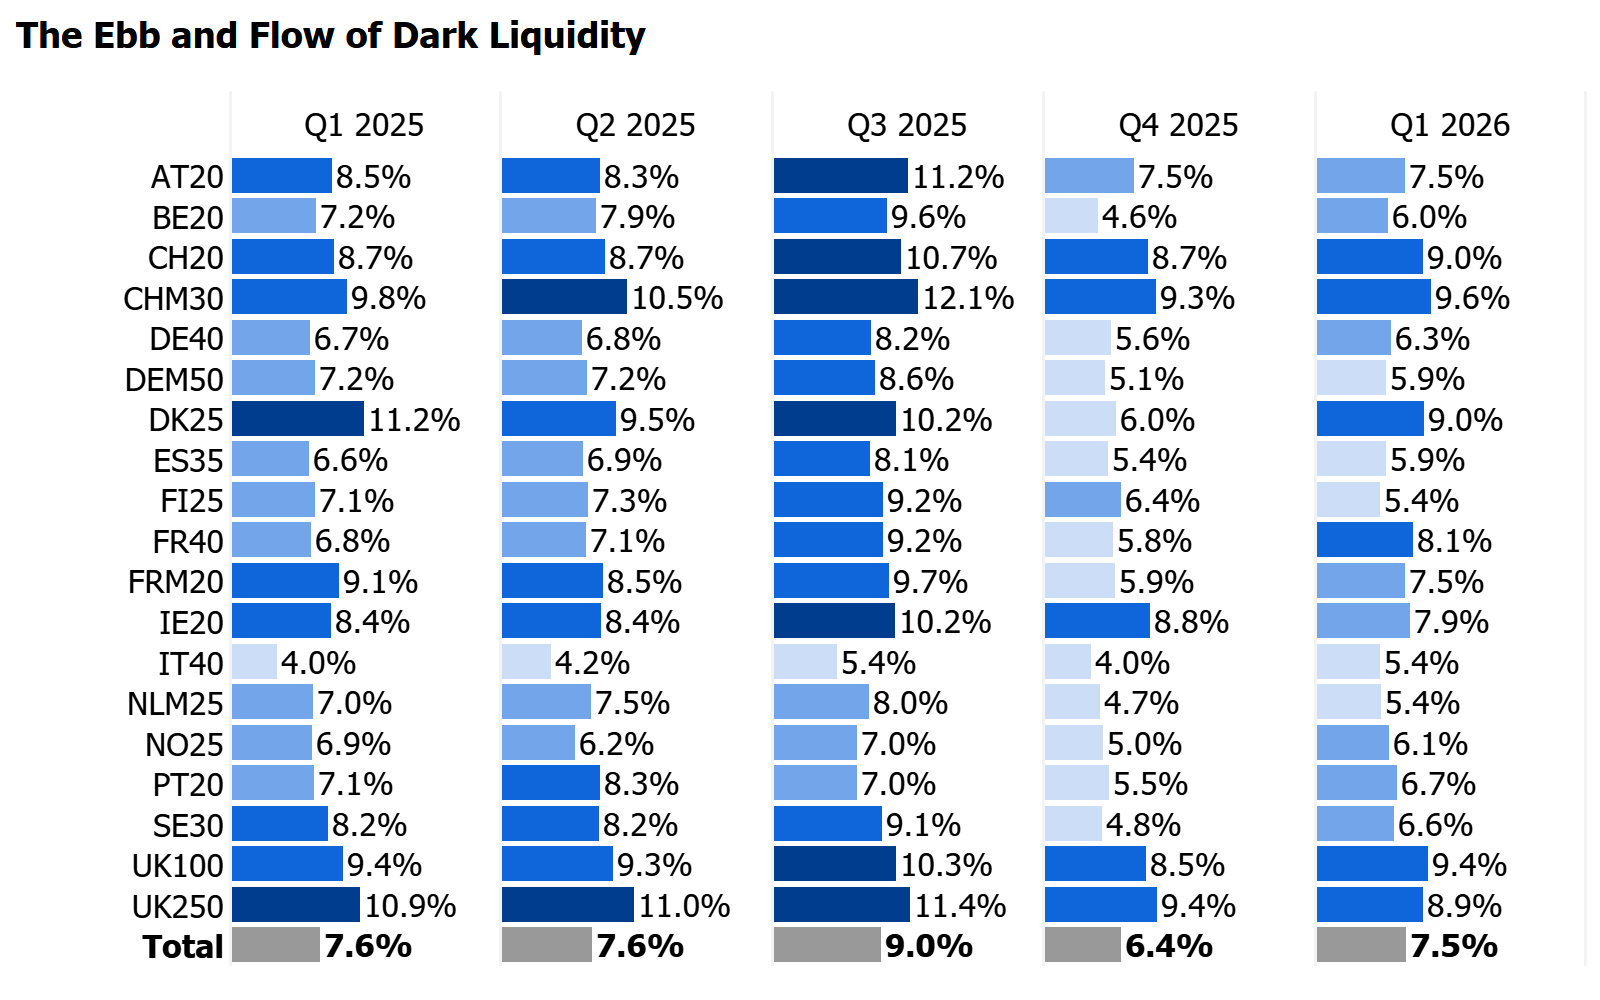
Figure 2: Dark Pool trading as a percentage of overall addressable liquidity from Q1 2025 to Q1 2026 by index. Colour intensity shows the highest or lowest distance from the simple average shown in the grand total.
The graphic demonstrates the importance of measuring the variation and trend in these liquidity pools and not only at country level but for each individual symbol.
Indexes containing M and the UK250 are mid cap indexes and reliably have higher levels than their large cap counterparts. Dark pools are more useful as liquidity declines. Dark pools tend to gain market share when overall market liquidity is lower - as seen in Q3 2025 which was the least liquid quarter of the year.
Reliable Liquidity Prediction
Figure 3 shows strong general correlation between both dark and periodic market share and addressable daily value (ADVT), demonstrating that their liquidity profile is structurally predictable.
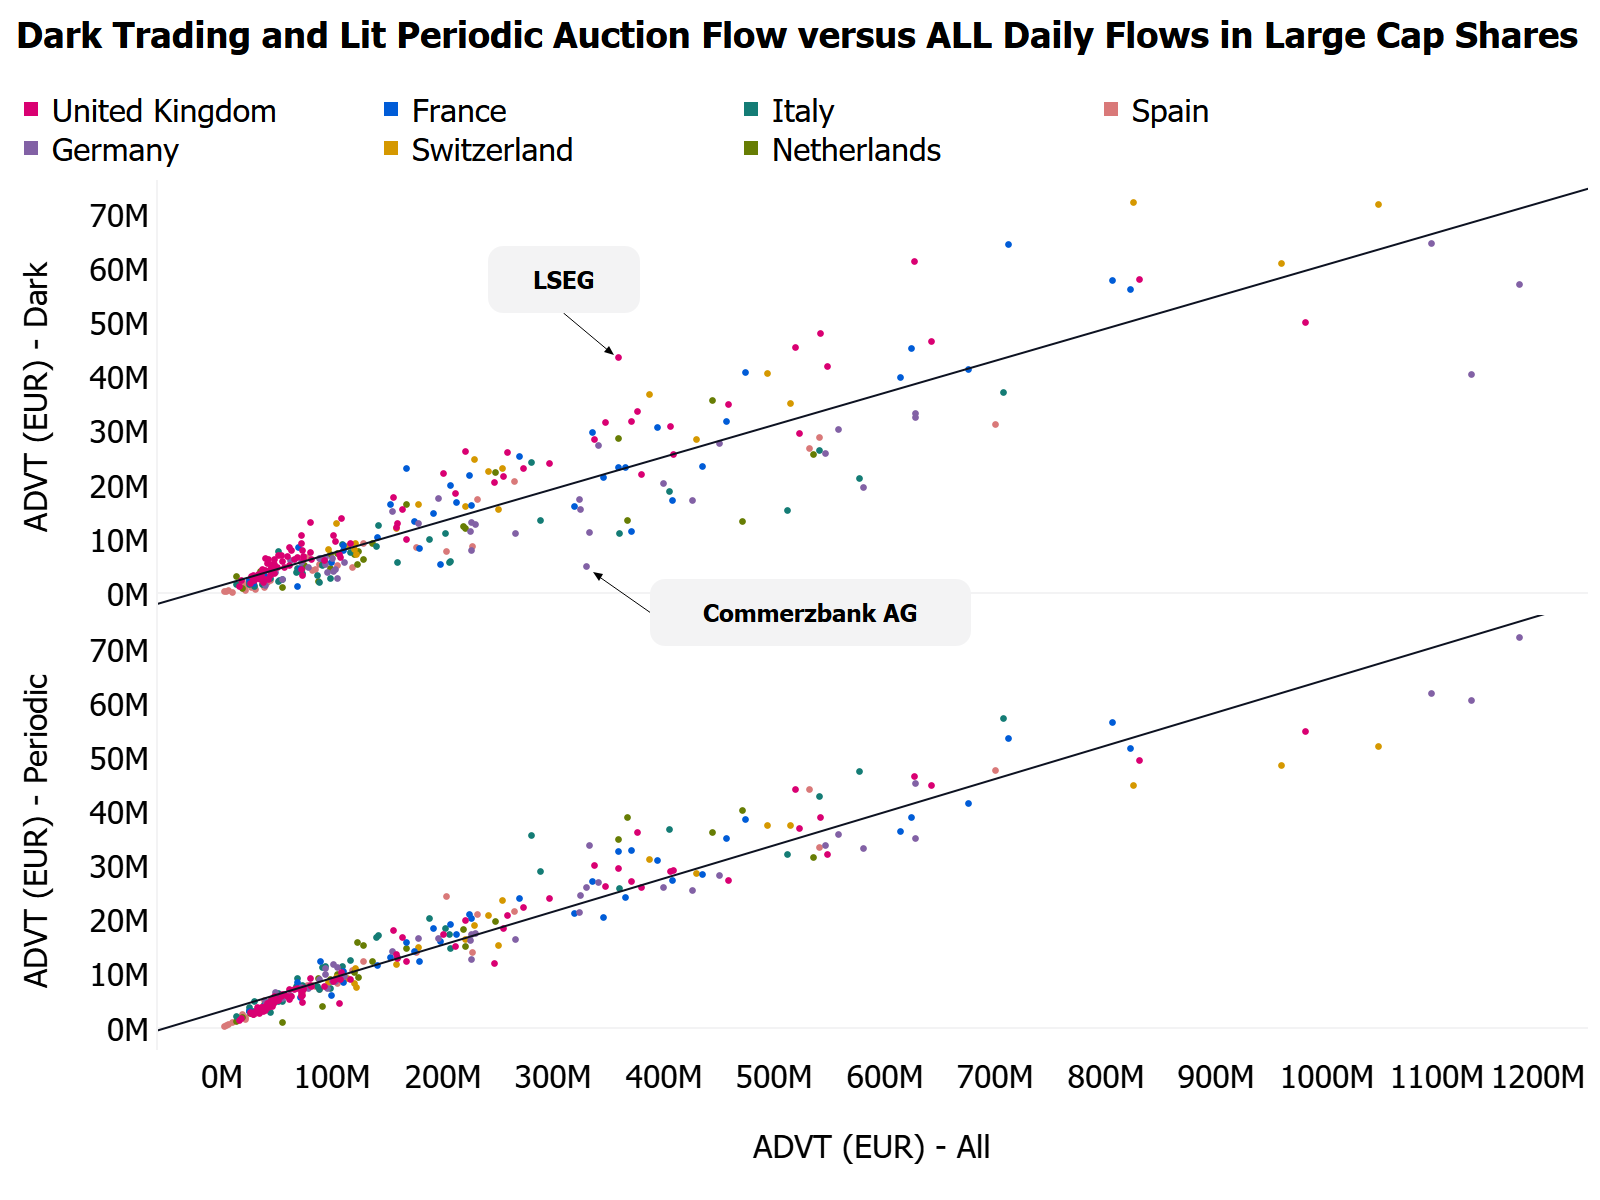
Figure 3: Dark Pool and Periodic Auction ADVT in euros, compared with total addressable market volumes by stock. Colour represents the regional view reflecting different regulatory regimes. Italian names tend to track lower, UK and Swiss names higher.
This chart is for illustration only. The relationship between dark trading and periodic auctions volumes with overall addressable liquidity is nuanced with less predictable volume curves. For example, dark trades can be very large and unexpected, especially when executed in conditional venues and must be controlled for when modelling recent historical volumes and intraday curves.
There is an effect where lower general liquidity leads to an increase in trading through these alternative venues. For execution teams, this predictability has a direct application: pre-trade models used to forecast market impact and calculate optional trading speeds must include these venues. Successful implementation requires data precision at scale as well as relevant metrics.
Conclusion
The intraday market has never been more fragmented. Whether this represents a structural improvement or a deterioration remains genuinely difficult to assess. For more than a year, macro-driven volatility has obscured the underlying microstructure trends, making it hard to isolate cause from effect.
What is clear is that the rapid rise of periodic auctions demands both attention and rigorous post-trade discipline. Pre-trade models must incorporate ADVT-based market share forecasts covering both dark pools and periodic auctions, calibrated by geography, market capitalisation, and individual stock characteristics. Trading distribution should be continuously measured against the market's own distribution, with performance metrics used to interrogate and justify any meaningful divergence.
Model inputs, historical ADV in particular, require regular review. In a microstructure landscape that is shifting as quickly as this one, stale assumptions carry real cost.
Notes on Trading Venue Mechanics.
Dark pools are familiar territory for most people. The technicalities; they match orders at the mid price of the order book with reference to the venue with the greatest share of trading. This is permitted under a waiver to the golden rule of MiFID which is that all electronic trading must be carried out on electronic orders books which publish price and size to the market at all times on a pre trade basis. The exception is called the ‘Reference Price Waiver’ (RPW) and was initially set by the regulators to an average of 8% of all daily volume over a 12 month period. This was changed in September 2025 to 7%. Should this cap be exceeded all dark venue operators must suspend trading in the affected name for six months. The mid cap restriction is a reason why dark volumes in Europe are much lower than in the US, where trading venues are permitted to execute trades at any price at or inside the touch.
A further exception to the RPW rule is available for orders above a certain ‘Large In Scale’ (LIS) threshold - normally more than €1m. Under the LIS waiver, if a symbol is restricted by the cap, a dark venue may admit orders that are above this threshold. These trades are included in the data shown in this episode. Yet another exception is that SI trading may execute orders of any size electronically.
Periodic auctions may be less familiar. They are ‘mini auctions’ operating at intervals ranging from 100 milliseconds to several seconds depending on venue rules. By publishing indicative uncrossing volumes and prices in real time and without being pegged to other lit trading venues they are considered price forming and therefore considered ‘lit’ and therefore survive any RPW caps and are not concerned with LIS rules. Orders execute according to time and price priority, with collaring to parent venues prevailing bid-offer applied to protect best execution rules.
Adding the market share of dark pools and periodic auctions puts European trading more or less in alignment with the market share of dark pools in the US.
Follow us on LinkedIn to stay up to date with the latest series of Liquidity Matters, news and platform enhancements.