


Episode 5: Alternative Closing Liquidity Matters
Institutional traders relying solely on primary exchange closing auctions for end-of-day trading may be missing out on up to €4.4 billion per day available through alternative liquidity pools. In 2025, 'at close' liquidity accounted for €15.2 billion per day - 22% of market volumes across Europe. Closing auctions accounted for only 16% of market volumes, or €10.8 billion per day. The alternative pools offer up to 29% more liquidity than the closing auction alone.
Why Closing Liquidity Matters
For traders using NAV and MOC benchmarks, the Close represents the opportunity to execute all or part of a trade with zero tracking error, to reduce overall market impact by minimising residual quantities that must be executed before the close, and to avoid gap risk. The additional liquidity pools offer the chance to optimise this opportunity.
Figure 1 shows the daily comparison of all available liquidity (including the closing auction) and alternative pools (excluding the closing auction) in 2025. In the previous episode of Liquidity Matters, we demonstrated how futures expiries drive very high spikes in at-close flows. The subject of alternative liquidity pools also links to these events.
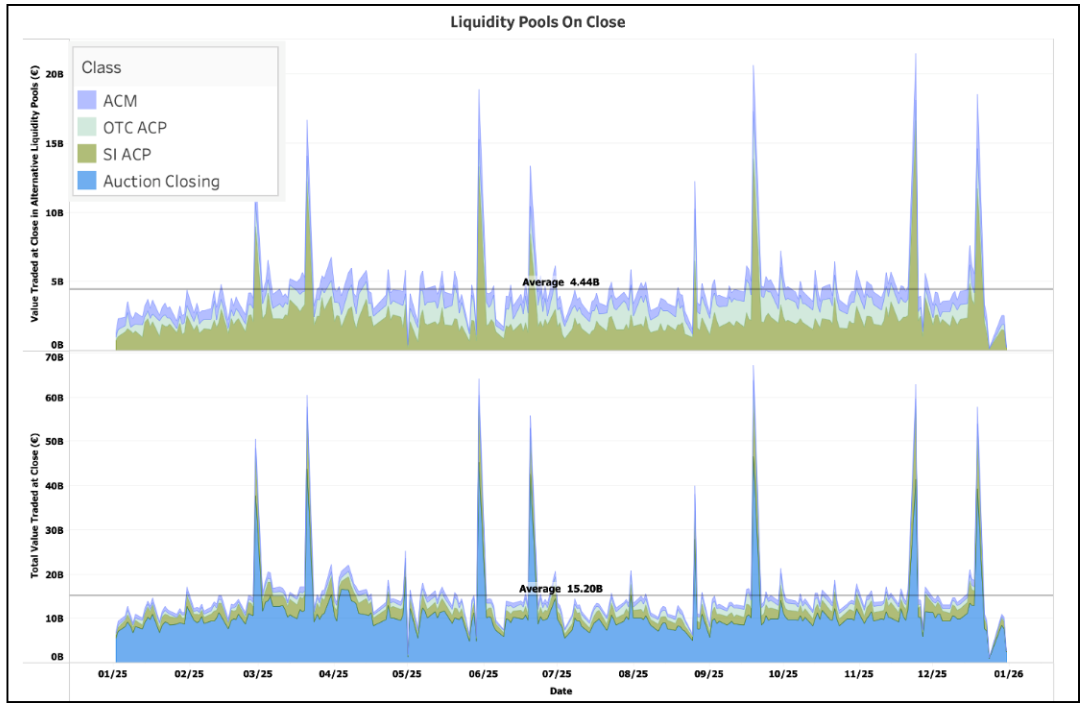
Figure 1: The lower panel shows all 'at close' liquidity pools, including the primary exchanges' closing auction period. The upper panel excludes the primary Closing Auction. The average difference in 2025 was €4.4 billion per day (29%).
Consider a €20 million trade in a liquid stock. If the primary closing auction averages €17 million daily, a 20% participation cap limits primary execution to €3.4 million. The remaining €16.6 million must be executed intraday or through alternative closing pools. Using our headline figures (bearing in mind the ratios change from stock to stock), by accessing alternative closing liquidity pools, the trader can route an additional 6.5% of the overall trade to alternative close liquidity pools, improving execution quality and reducing overnight position exposure. This shift in execution timing directly reduces tracking error to the NAV or MOC benchmark.
Where is the Additional Liquidity Found?
Alternative closing liquidity divides into three categories:
Alternative Closing Mechanisms (ACMs): €900 million daily (1.3% of daily volumes)
MTF and exchange-operated electronic platforms execute the equivalent of 8.3% of primary closing volume. These are fully addressable through brokers with the required market access. ACMs operate in two formats: parallel-timed mechanisms synchronised with primary auctions (lower fees, same closing price), and post-close platforms that capture residual quantities after primary price discovery. All execute at the primary closing price, preserving the primary auction as the price-formation venue.
Banks and liquidity providers execute bilateral trades at the primary closing price away from order books.
Over-the-Counter at Close (OTC 'At Closing Print'): €1.2 billion daily (1.7% of daily volumes)
This consists of negotiated bilateral closing trades not classified as bank internalisation. These flows typically involve large block trades where price is negotiated directly between parties.
Together, SI and OTC account for €3.6 billion daily, equivalent to 33% of primary closing auction volume and 5.3% of overall daily market turnover. As these mechanisms are bilateral, they are not 100% addressable. Investors gain market access through their broker networks, investment in IOI/RFQ technology, and ongoing relationships with risk providers.*
Implementation: The Critical Questions
Access to alternative closing liquidity requires systematic answers to three questions:
Does your broker network provide sufficient execution access to ACMs and bilateral closing flows?
Does your pre-trade execution model account for closing volume across all pools, or only the primary auction, and is it properly calibrated at stock level?
Does your post-trade analysis capture execution rates across all closing pools?
The answer to these questions lies in an investor’s capabilities in measuring trading volume distribution (for example primary vs. ACM vs. bilateral) and execution quality (for example benchmark slippage) at the level of individual liquidity pools and venues.
Conclusion
The €4.4 billion in daily alternative closing liquidity is not marginal. For trades benchmarked to NAV or MOC, systematic access to these pools can reduce intraday market impact, tracking error, and gap risk.
However, capturing this opportunity requires acquiring, processing, and classifying very high volumes of data at stock level, billions of data points a day. It demands sophisticated pre-trade models and post-trade analytics, and optimised market access, whether directly or through brokers, for ACMs and bilateral flows. Without these capabilities, investors may miss the opportunity to optimise their trading costs.
Follow us on LinkedIn to stay up to date with the latest series of Liquidity Matters, news and platform enhancements.
*Categorisation of off order book trades into bi-lateral buckets requires detailed examination of trade reports. Using the industry standard ‘MMT’ (Market Model Typology) we condense all trade reports by filtering out trades that are reported as ‘non price forming’ or ‘technical’ or with a price that does not precisely match the official close.