


Episode 3: Why Spreads Matter
Understanding the cost of immediate liquidity is essential for both trade planning and post-trade analysis. The quoted bid-ask spread is commonly used as a proxy for this cost—but how reliable is it?
For Europe's most liquid large-cap stocks, headline spreads range from around 3.5 basis points in Paris to 5.5 basis points in London. This roughly reflects what a retail investor pays for immediate execution on a small trade, say €5,000. It's also close to what institutional investors end up paying when they break larger orders into smaller pieces.
But here's what makes the spread less useful as a benchmark: only 52% of trades are €5,000 or smaller, and just 76% fall at or below €25,000. For nearly half of all trades, the quoted spread may not accurately reflect the true cost of execution.
When you account for size distribution, a different picture emerges. The spread at €25,000 is roughly 25% wider in Paris (4.4 basis points) and 35% wider in London (7.4 basis points). This is the spread premium—essentially, the additional cost of accessing liquidity in larger sizes. For a large-cap fund with €50bn under management that reweights 10% of holdings annually whilst accommodating 10% gross inflows and outflows, this gap translates to around €4.4m per year, leaking away from returns. That's not trivial.
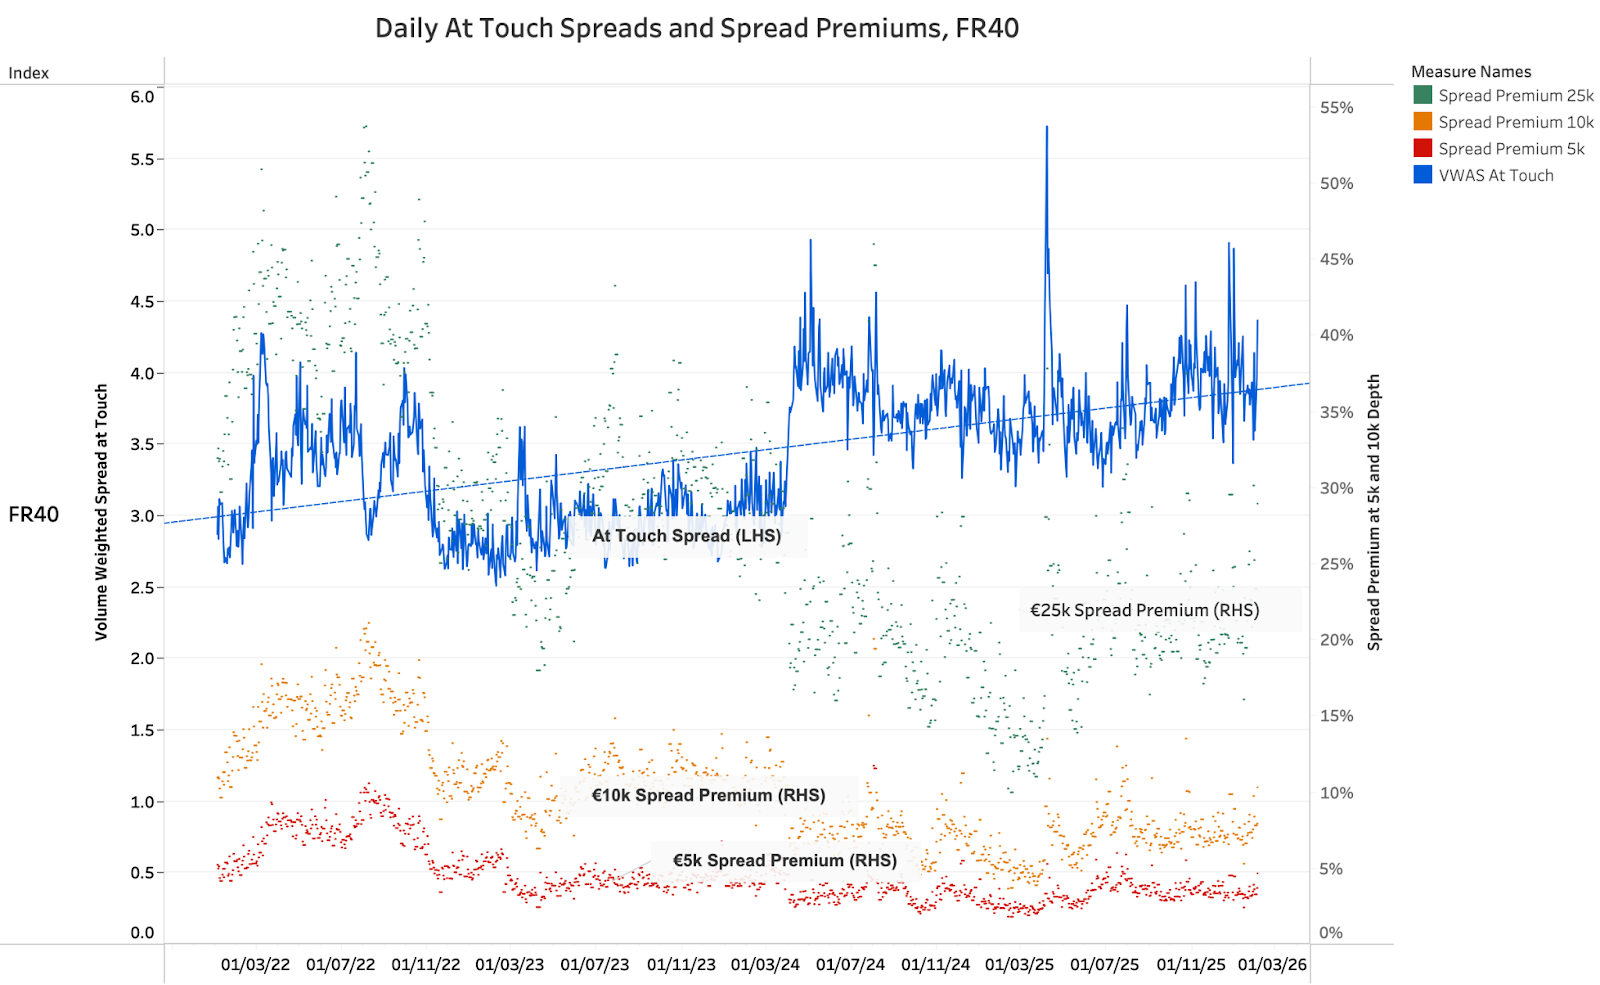
Figure 1: At Touch Spreads and various spread premiums for the FR40 since 2022. For methodology see notes below.
Looking at the chart, the at-touch spread (blue) appears highly volatile, and trending upwards wider. When market volumes are subdued and volatility is muted as in the volume drought of 2023 and early 2024, spreads decrease. This is counterintuitive, as we might imagine that the greater the liquidity available, the tighter the spreads. Yet despite these fluctuations, outside of sharp volatility spikes, the at-touch spread remains fairly bounded and therefore reasonably reliable as an anchor for predicting costs. The €5,000 spread premium (red) is very stable below 0.5 basis point, reflecting that the order book nearly always has capacity for such trades. This is also true of the €10,000 spread premium (yellow) which adds another 0.5bps and is a dependable guide for 52% of trades.
At €25,000, the premium (green) grows quickly, adding up to 4bps in 2025, and indicating that the book may not be liquid enough for the 7% of trades reaching these size levels.
This is where two distinct components of the quoted spread become visible. There's the explicit cost, the direct charge for execution and settlement which is highly predictable and implicit cost, which is the reward dealers and passive traders demand for providing liquidity. When markets are settled, this reward can remain relatively modest. When they're unsettled, it must rise.
The gap between the €5,000 premium and the €25,000 premium appears to capture something of this implicit pricing for volatility. What's striking about the €25,000 premium is that it doesn't move randomly. It clusters, it persists, it shows memory. It's correlated with volatility regimes, but it doesn't simply flip in and out, it stays elevated during stressful periods and takes time to recede. This is vital for understanding the additional costs of trading during and after volatile periods, which should feed into your trading decisions.
When Market Microstructure Changes
A highly revealing moment in this chart comes in April 2024. Before that date, the €25,000 premium drifts gradually upward, but from the 2nd onwards, there's a distinct shift in the baseline. The at-touch spread becomes noticeably more volatile, and the premium sits persistently higher. In fact, it did.
ESMA's quarterly tick size reclassification in early April recalibrated the minimum price increment for French large-caps, effectively widening the tick grid. Dealers immediately adjusted their quoting behaviour to this new constraint, and the cost of accessing depth appears to have settled into a higher equilibrium. This is where regime shifts become particularly awkward for practitioners.
Any backtesting model calibrated on pre-April data will systematically underestimate transaction costs going forward. The historical relationship between volatility and spreads, so carefully fitted to the 2022-2024 period, no longer holds. Whether this new regime proves permanent or cyclical remains to be seen, but the lesson is rather pointed: the past is a less reliable guide when the microstructure changes.
This has real implications for how we measure trading costs. Average spread data feeds directly into pre-trade cost models, which in turn shape decisions about execution speed, timing, and algorithm design. The same data informs asset selection and regulatory liquidity reporting under frameworks like PRIIPS.
Choosing the right metric for your trading activity isn't simple. The data is vast with billions of data points daily, expensive to capture, maintain, and refine. But if better measurement saves you €4.4m a year, the investment pays for itself.
Follow us on LinkedIn to stay up to date with the latest series of Liquidity Matters, news and platform enhancements.