12 Days of Trading – Day 9 of 12: Average Equity Spreads
18 December 2018
/
big xyt
big xyt
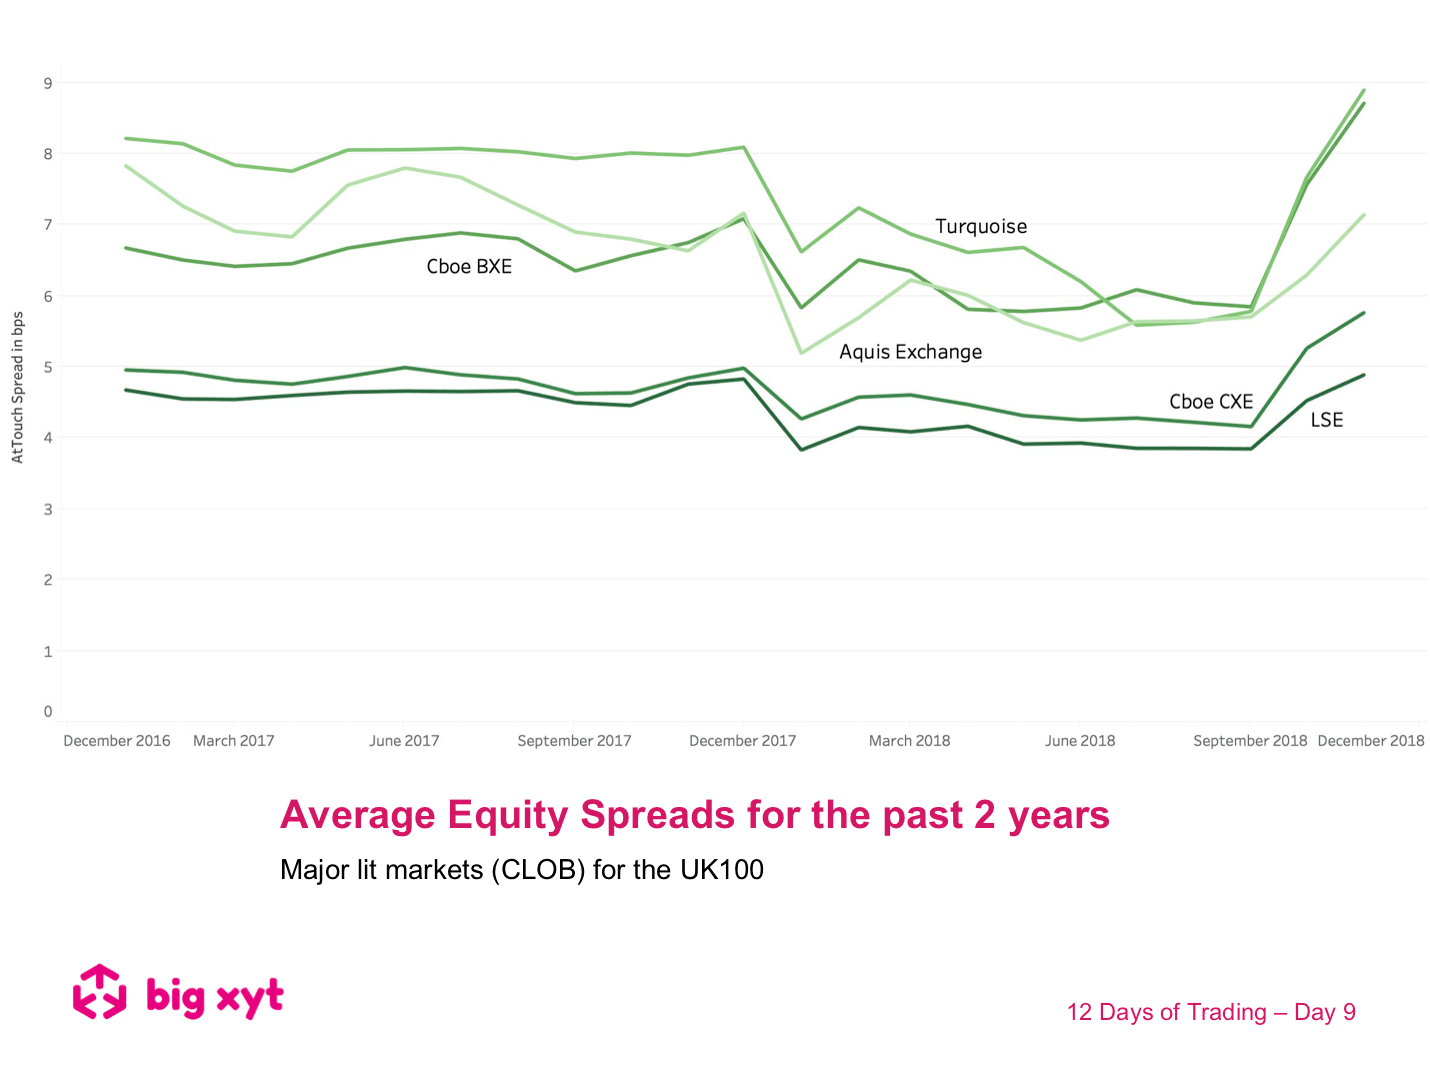
Day 9 of 12: Average Equity Spreads for the past 2 years
The chart shows at touch time-weighted average spreads for blue chip UK stocks since December 2016
Some observations:
There was observed impact of MiFID II with a new tick size regime and an increasingly competitive market.
The influence of macro-economic uncertainty on volatility during February 2018 and Q4 2018.
It is possible to look at Presence in parallel with spreads to establish how often a given venue has the best price either uniquely or along with other venues – an important measure when considering PBBO or EBBO referencing or other benchmarking.
—
Do you want to receive future updates directly via email? Use the following form to subscribe.
On our 12 Days of Trading
As the year draws to a close we have been asked by clients to look and highlight 2018 trends since the introduction of MiFID II. We thought we might make this a festive exercise on the 12 days leading up to the holidays. As a result, you will find a post to a different 2018 big-xyt observation each day.
We hope you enjoy them.
—
This content has been created using the Liquidity Cockpit API.
About the Liquidity Cockpit
At big-xyt we take great pride in providing solutions to the complex challenges of data analysis. Navigating in fragmented markets remains a challenge for all participants. We recognise that the investing community needs and expects continued innovation as the volume of data and related complexity continues to increase.
Our Liquidity Cockpit is now recognised as an essential independent tool for exchanges, Sell-side and increasingly Buy-side market participants. Data quality is a key component, as is a robust process for normalisation so that like-for-like comparisons and trends over time have relevance. However, our clients most value a choice of flexible delivery methods which can be via interactive dashboard or direct access to underlying data and analysis through CSV, API or other appropriate mechanism.