12 Days of Trading – Day 8 of 12: Average Price Move
17 December 2018
/
big xyt
big xyt
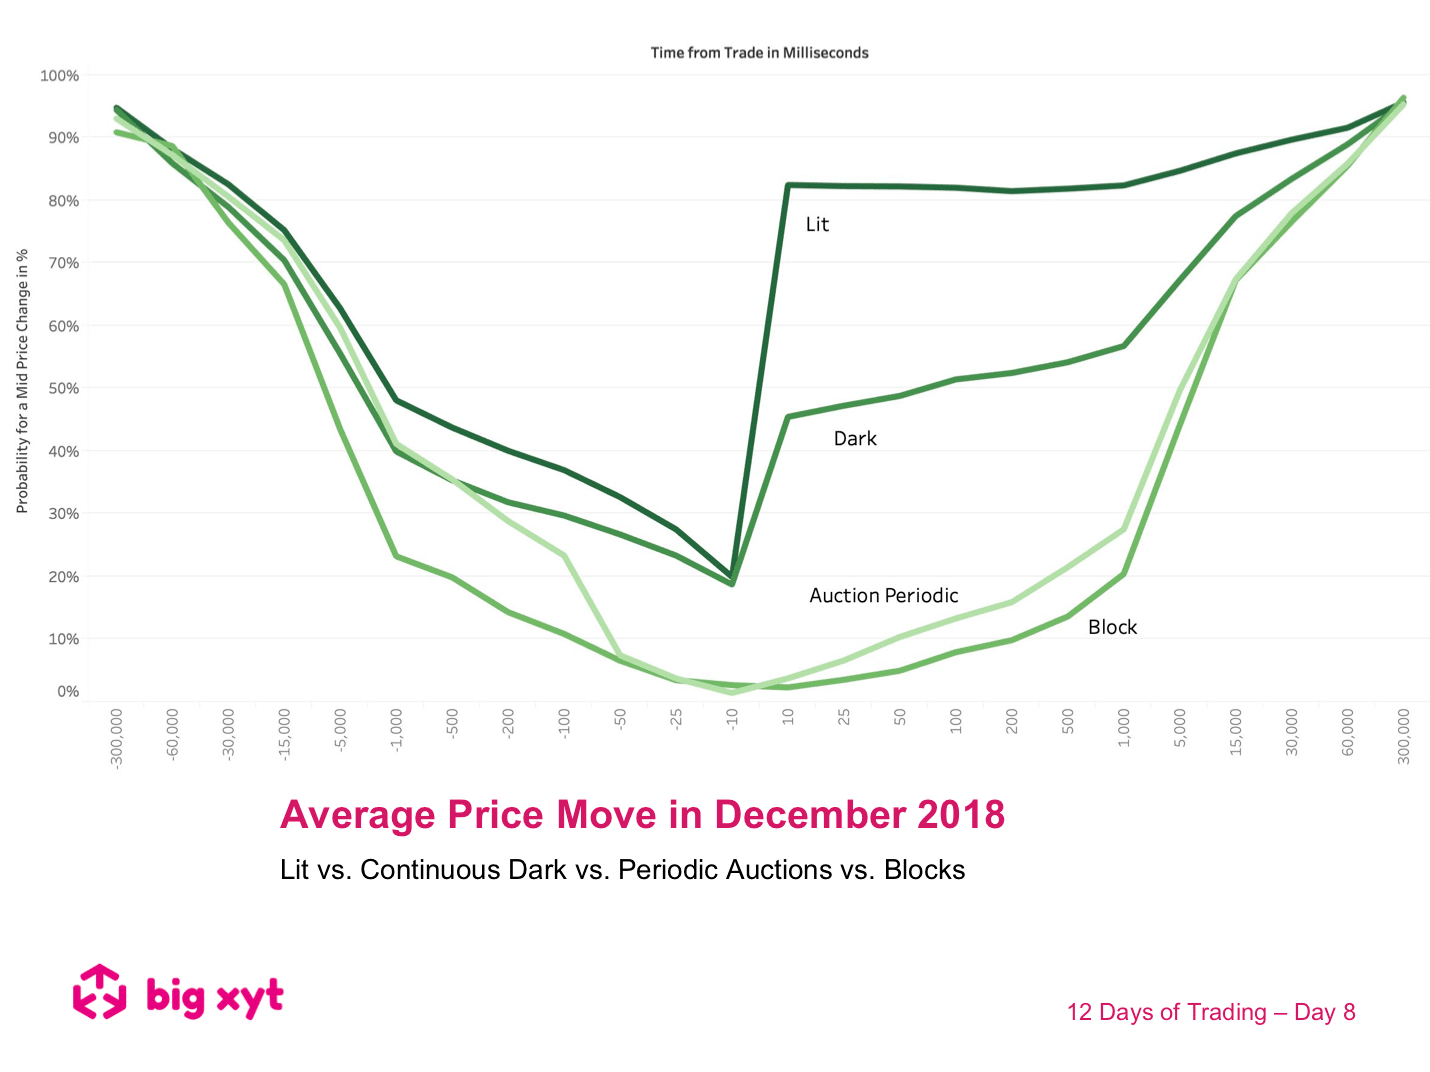
Day 8 of 12: Price movement as a proxy for market impact – A ripple before as well as after the pebble hits the water
Measuring the movement of mid point prices before and after the time of every execution allows us to see some interesting patterns emerge.
Some observations:
Different execution mechanisms exhibit distinct trajectories.
The patterns for lit markets, dark pools and blocks have been known for some time. Where do Periodic Auctions fit in?
Up to 100 ms ahead of the trade, Periodic Auctions show a similar probability for a market move as Dark Pools. Closer to the execution time as well as after the trade, the probability for a price movement is very low and close to blocks (LIS).
—
Do you want to receive future updates directly via email? Use the following form to subscribe.
On our 12 Days of Trading
As the year draws to a close we have been asked by clients to look and highlight 2018 trends since the introduction of MiFID II. We thought we might make this a festive exercise on the 12 days leading up to the holidays. As a result, you will find a post to a different 2018 big-xyt observation each day.
We hope you enjoy them.
—
This content has been created using the Liquidity Cockpit API.
About the Liquidity Cockpit
At big-xyt we take great pride in providing solutions to the complex challenges of data analysis. Navigating in fragmented markets remains a challenge for all participants. We recognise that the investing community needs and expects continued innovation as the volume of data and related complexity continues to increase.
Our Liquidity Cockpit is now recognised as an essential independent tool for exchanges, Sell-side and increasingly Buy-side market participants. Data quality is a key component, as is a robust process for normalisation so that like-for-like comparisons and trends over time have relevance. However, our clients most value a choice of flexible delivery methods which can be via interactive dashboard or direct access to underlying data and analysis through CSV, API or other appropriate mechanism.