
Liquidity Matters Weekly Series
Click the links below to read the full blog series:
- Introducing Liquidity Matters
- Episode 1: Why Addressable Liquidity Matters
- Episode 2: The Cost of Liquidity
- Episode 3: Why Spreads Matter
- Episode 4: Why Expiry Dynamics Matter
- Episode 5: Alternative Closing Liquidity Matters
- Episode 6: Cross Asset ETPs Matter
- Episode 7: Dark Pools and Periodic Auctions Matter - Alternative Intraday Liquidity
- Episode 8: Implicit Trading Costs Matter Part 1 - Cost Dynamics
- Episode 9: Implicit Trading Costs Matter Part 2 - Liquidity Pool Mechanics
- Episode 10: Does Latency Matter?
- Episode 11: Shining the light on retail flows
- Episode 12: Retail ETFs; Venue Selection Matters
- Episode 13: Volume Curves and the Fragmented Market
- Episode 14: Spread Cost Precision Matters
- Episode 15: Measuring ETF Liquidity During Volatile Markets
Introducing Liquidity Matters
Financial markets operate through the medium of liquidity, enabling the efficient transfer of assets between buyers and sellers. The normal state of liquidity is asymmetric, ebbing and flowing continuously around an asset’s fair value until a supply and demand equilibrium appears.
Price is the conduit for this equilibrium, and the process is known as price formation; it is fuelled by competition, and benefits from market concentration and price transparency. High demand dictates a higher price, low demand a lower price. Thus liquidity and volatility are inextricably linked and in turn so are trading costs, risk and asset returns.
This is relevant to investors and issuers alike. A company may have great financial results, but if the shares are illiquid, investors require a higher risk premium and therefore a lower price.
Like fund managers, issuers care about liquidity too and work hard to maintain it in the market through corporate actions and other interventions. They also care about inclusion in indexes as they form the basis of investment vehicles (or products) that allow for passive investment of which many ETFs are created from. These investment vehicles increase liquidity and demand for their stocks, as we see during re-constitution events. Investors expect management to be aware of the liquidity in their shares.
Our Liquidity Matters series helps both generalists and specialists across all industry stakeholders to understand the market structure and its application to practical matters such as asset selection and trading, and highlights recent trends and notable events. Complexity in the market micro-structure, often referred to as the fragmentation of liquidity pools, presents challenges for managing trading costs and therefore asset returns, for accurate risk management and reporting. Our aim is to help clarify and summarise this complexity, using illustrations from our sophisticated data analytics and recent market observations.
Follow us on LinkedIn to follow the series.
Episode 1: Why Addressable Liquidity Matters
Headline trading volume figures routinely overstate the magnitude of liquidity available to investors, and by as much as €28bn euros per day in Europe based on 2025 data. This is 32% higher than the amount investors can reasonably rely upon for estimating trading costs and for investment decisions. The industry refers to the more precise notion of Addressable Liquidity. In this episode, we describe this concept and why it matters.
The discrepancy of 32% is illustrated in the chart below, which introduces the difference between ‘On Order Book’ trades (in blue) and ‘Off Order Book’ trades (in green). In this episode, we will expand upon this high-level definition of On and Off Order Book trading, which forms the foundational structure of the European equity microstructure as enforced by regulation.
The left chart shows headline volumes of €115bn Average Daily Value Traded ‘ADVT’; with just 45% traded on the order book. The right chart shows the adjusted number for Addressable ADVT of €87bn, with 60% traded on the order book.

This substantial difference is found in the Off Order Book segment, where the market’s trade reports must be sifted and categorised to eliminate trades that do not interact with the market, and therefore neither contribute nor take liquidity, nor contribute to price formation. On Order Book trades do not require this treatment as they are produced directly by electronic matching engines using strict regulatory definitions. A further complication is that Off Order Book trades are published with up to a minute’s delay whereas On Order Book trades are published instantly.
How is Addressability defined?
Addressability refers to whether a given market participant can access a pool of liquidity systematically through automation, phone calls, chat or other mechanisms, with a reasonable probability of trading at a price which is at least as good as any other currently available in the market for a given size. Addressable liquidity is different for every participant because it depends on their technical setup (for example their access to electronic trading venues), network of brokers and market makers who can help them to find counterparties bilaterally or offer risk.
Why does the difference matter?
The difference between headline and addressable liquidity matters because a precise understanding of the size and reliability of liquidity is essential to avoid unexpected performance decay induced by implicit trading costs, especially during major events such as transitions, rebalances and substantial cash inflows and outflows. This is because estimates of trading impact, normally based on liquidity and its close relationship to volatility, are only as good as the predicted size of the liquidity available, measured through spreads and market depth. If trading costs are not accurately modelled, you may trade too fast, too slow, or with the wrong hedge. Consequently this affects returns performance and risk management. This also affects the quality of regulatory reporting as required under PRIIPS.
Therefore, liquidity should be ‘reliable’ in the sense that its size and distribution among different trading mechanisms and venues should be reasonably predictable with reference to recent history (normally 20 days). Non addressable liquidity should be eliminated from pre trade estimates, order routing strategies and post trade performance reporting.
How do we identify and measure addressability?
The blue-ish colours in the charts represent liquidity pools consistently available to everyone: in this case European Exchanges and MTFs, where multilateral, electronic trading takes place on a first-come, first-served basis, either continuously or in auctions. This is reliable, 100% addressable liquidity, that provides predictive value over ongoing liquidity availability provided that investors, through their brokers, have appropriate memberships and technical access to these venues. This landscape is constantly changing as venues innovate their services with new market mechanisms to try to capture liquidity from their competitors. Stakeholders in the industry must remain vigilant in following these trends to monitor whether their capabilities are up to date and can access these pools effectively.
The green-ish colours represent bilateral trades away from the Order Books of Exchanges and MTFs; between brokers on behalf of clients, market makers, or proprietary trading firms. These trades occur between two counterparties only, away from the competitive multilateral electronic venues. We have categorised these trades as ‘Internalisation’ (normally risk trades executed by investment banks) ‘Agency Off Book’ (cross trades between brokers on behalf of investors) and ‘OTC’ for everything else. Liquidity is more fragmented in these categories because trading is ‘bilateral’ and less visible. Every broker and market maker represents a potential pool of liquidity, which compels an investor to build and maintain a network of brokers and to invest in electronic RFQ and IOI mechanisms. Therefore, this type of liquidity is less reliable and not 100% addressable.
A firm must assess whether their execution is broadly distributed in line with the market share of all these liquidity pools in granular detail to gain an understanding of whether they are proportionately accessible to them for their needs, and if not be able to justify whether over-performance justifies a bias towards some pools more than others. In future episodes of Liquidity Matters we will dive into the details of the different types of Off Order book liquidity pools and explain their structure and measurement.
Why does a gap exist between Addressable and Non Addressable Liquidity?
All trades transferring beneficial ownership must be publicly reported. However, many are duplications or technical in nature and therefore do not contribute to price formation or provide a liquidity pool. These are highly varied in nature and can be very large. A common example is a ‘back to back’ trade where risk positions are consolidated into a single entity of an investment bank from its local dealing entities in other countries. These trades are classified in the Off Order Book category but in effect double count ‘real’ trading that has probably taken place earlier in the day in the local market. We must filter out this kind of trade to determine Addressability and sub-categorise Off Order Book trading to provide more visibility. This reclassification exercise produces the €28bn difference between headline figures and the more reliable Addressable Liquidity estimate.
Not all shares follow the same liquidity pattern.
Crucially, the picture varies significantly between shares; for example mid and small caps trade a larger proportion away from order books than in the case of large caps. This variation has material implications for portfolio construction and execution planning where inclusion criteria include liquidity thresholds. In the next episode of Liquidity Matters we will be looking at the measurement of trading cost by type of trading venue to investigate the relative cost of using different liquidity pools.
Taking Action
Precise measurement of Addressable Liquidity is a must have for investment and trading decisions and risk management. For precise measurement, xyt provides Addressable Liquidity Datasets for daily consumption. This provides high levels of granularity (symbol, sector, index, country etc) and is delivered through flexible access methods (via files, APIs or via our App) to help you explore or integrate Addressable Liquidity estimates into your internal workflows.
Follow us on LinkedIn to stay up to date with the latest series of Liquidity Matters, news and platform enhancements.
Episode 2: The Cost of Liquidity
Understanding where and how trades execute relative to the best available price is fundamental to managing execution costs. While our first episode explored the concept of liquidity pool addressability, we take the analysis deeper by examining the price premia associated with different types of trading venue. By measuring what proportion of trades execute at, inside, or outside the consolidated European Best Bid/Offer (EBBO), we can quantify trading cost differences between liquidity pools and make more informed decisions about where to route orders.
Using the EBBO, and a benchmark of the bid for a seller and the offer for a buyer, we can measure whether a liquidity pool offers a premium (or discount) for immediate liquidity versus current prevailing price. Deviation from the benchmark suggests increased (or decreased) liquidity cost and the analysis can be used to assess whether any execution bias towards one type of pool or another is justified.
As shown in the first chart, the ‘default’ position is the electronic intraday liquidity pool, consisting of the displayed and non displayed books and periodic auctions. This is the ‘most addressable’ intraday liquidity pool. As trade size is a determining factor for the liquidity premium, among others such as availability of liquidity and volatility, we use it to build a granular view of the premium across different types of liquidity pool.

Figure 1: Distribution of trades by size buckets for European markets, March 2025 to January 2026. The upper panel shows average daily value traded in EUR at each price point. The lower panel shows the ratio of trades per price bucket at the given price point to all trades in all price buckets.
Figure 1 illustrates that over 96.5% of all trades fall into a size range below €25k, representing 61% of intraday order book liquidity. Of these, the proportion of trades executed at the EBBO is 77% with a further 19% falling inside the touch, with the latter being in periodic auctions and dark pools. This is a good demonstration of the value of these mechanisms in drawing order flow into the multilateral marketplace. On a value weighted basis across all buckets, 96% of trades pay no premium to EBBO, and of these 28% receive a discount. This underlines the importance of the electronic order books as not only the most substantial liquidity pool but also the most reliable, even at larger sizes.
But why not 100% for all order sizes? Owing to the fragmentation of the order books, latency in order routing means it is possible for an aggressive order to be ‘in flight’ on its way to one trading venue when a better price simultaneously appears on another venue. Secondly an order that ‘drills the book’ by taking more than one price level without reference to prices on other venues may fall outside EBBO. Maybe it is more surprising that this figure (less than 4% of all trades) is not higher. It is a sign that the market is efficient in respect of order routing and dealing with latency. It is not shown in the chart but curiously, the phenomenon affects buy orders more than sell orders (let us know if you want the details).
Next we move to the Off Order Book liquidity pools, depicted in the second chart. As discussed in Episode 1, these liquidity pools are less addressable as they depend on an investment firm’s access to a network of brokers or market makers and their IOI/RFQ setup.

Figure 2: Distribution of trades by execution price point and by size buckets for European markets, March 2025 to January 2026. The label in both panels depicts the average daily value traded in EUR per price point and ratio of all trades executed in a given size bucket to the overall number of trades.
First, a caveat; Off Order Book trades must be reported by a market participant (as opposed to an electronic trading venue) via a trade reporting facility. The time limit set by the regulators to submit a report following a trade is one minute. This means analysis of these trades suffers a time lag to the EBBO, although much of the reporting is automated and instantaneous, particularly in the case of internalisation. This is noticeable in that 29% of trades are executed outside of the EBBO benchmark in the Agency Crossing category and 12% in the Internalisation category, compared with only 4% for the Order Books. Using a time window of one minute as a tolerance for EBBO will significantly reduce this effect - such a tool is available in our Best Execution analytics service.
Nevertheless, Agency Crossing and Internalisation liquidity pools demonstrate very high levels of EBBO price improvement with 50% of trades executed inside the touch - a significant liquidity discount and more than the Order Books at 19%. Of course, these two Off Order Book liquidity pools account for only 16% of smaller trade sizes executed on the Order Books, an indication of the proportion of trades that could be potentially drawn back into the Order Book if spreads were tighter.
When we scale up the trade size bucket to look at trades above €500k, we find that trading in these two liquidity pools is 5.4x more than that of the Order Books by value, as would be expected. The proportion executed outside of EBBO is 77.5% which indicates that these are trades where prices may be manually negotiated and where the reporting latency is a significant factor.

Figure 3: Consolidation of all trade categories, On Order Book and Off Order Book, March 2025 to January 2026.
Figure 3 brings together the first two charts to give a consolidated view of the whole market showing that the bigger the trade, the higher the liquidity premium, as expected. The data reveals a clear hierarchy in execution quality across liquidity pools. Intraday order book trading delivers the most consistent EBBO execution for small and medium sized trades, while Off Order book liquidity pools offer greater price improvement through mid-point matching, but for a smaller pool of liquidity.
For larger trades, the picture shifts considerably, with negotiated executions and dark pools playing a dominant role despite higher apparent deviation from EBBO benchmarks. These findings underscore the importance of precise monitoring and demonstrate that execution strategies should be calibrated not just to trade size, but to the specific cost characteristics of each type of liquidity pool and each trading venue. Investors can compare their own trading results to this overall summary of the market to identify the strengths and weaknesses of their routing strategies.
In our next episode of Liquidity Matters we will extend this analysis to examine whether the quality of a liquidity pool is durable, i.e. whether the premium paid for immediate liquidity erodes over time as price evolves, or increases.
Follow us on LinkedIn to stay up to date with the latest series of Liquidity Matters, news and platform enhancements.
Episode 3: Why Spreads Matter
Understanding the cost of immediate liquidity is essential for both trade planning and post-trade analysis. The quoted bid-ask spread is commonly used as a proxy for this cost—but how reliable is it?
For Europe's most liquid large-cap stocks, headline spreads range from around 3.5 basis points in Paris to 5.5 basis points in London. This roughly reflects what a retail investor pays for immediate execution on a small trade, say €5,000. It's also close to what institutional investors end up paying when they break larger orders into smaller pieces.
But here's what makes the spread less useful as a benchmark: only 52% of trades are €5,000 or smaller, and just 76% fall at or below €25,000. For nearly half of all trades, the quoted spread may not accurately reflect the true cost of execution.
When you account for size distribution, a different picture emerges. The spread at €25,000 is roughly 25% wider in Paris (4.4 basis points) and 35% wider in London (7.4 basis points). This is the spread premium—essentially, the additional cost of accessing liquidity in larger sizes. For a large-cap fund with €50bn under management that reweights 10% of holdings annually whilst accommodating 10% gross inflows and outflows, this gap translates to around €4.4m per year, leaking away from returns. That's not trivial.

Figure 1: At Touch Spreads and various spread premiums for the FR40 since 2022. For methodology see notes below.
Looking at the chart, the at-touch spread (blue) appears highly volatile, and trending upwards wider. When market volumes are subdued and volatility is muted as in the volume drought of 2023 and early 2024, spreads decrease. This is counterintuitive, as we might imagine that the greater the liquidity available, the tighter the spreads. Yet despite these fluctuations, outside of sharp volatility spikes, the at-touch spread remains fairly bounded and therefore reasonably reliable as an anchor for predicting costs. The €5,000 spread premium (red) is very stable below 0.5 basis point, reflecting that the order book nearly always has capacity for such trades. This is also true of the €10,000 spread premium (yellow) which adds another 0.5bps and is a dependable guide for 52% of trades.
At €25,000, the premium (green) grows quickly, adding up to 4bps in 2025, and indicating that the book may not be liquid enough for the 7% of trades reaching these size levels.
This is where two distinct components of the quoted spread become visible. There's the explicit cost, the direct charge for execution and settlement which is highly predictable and implicit cost, which is the reward dealers and passive traders demand for providing liquidity. When markets are settled, this reward can remain relatively modest. When they're unsettled, it must rise.
The gap between the €5,000 premium and the €25,000 premium appears to capture something of this implicit pricing for volatility. What's striking about the €25,000 premium is that it doesn't move randomly. It clusters, it persists, it shows memory. It's correlated with volatility regimes, but it doesn't simply flip in and out, it stays elevated during stressful periods and takes time to recede. This is vital for understanding the additional costs of trading during and after volatile periods, which should feed into your trading decisions.
When Market Microstructure Changes
A highly revealing moment in this chart comes in April 2024. Before that date, the €25,000 premium drifts gradually upward, but from the 2nd onwards, there's a distinct shift in the baseline. The at-touch spread becomes noticeably more volatile, and the premium sits persistently higher. In fact, it did.
ESMA's quarterly tick size reclassification in early April recalibrated the minimum price increment for French large-caps, effectively widening the tick grid. Dealers immediately adjusted their quoting behaviour to this new constraint, and the cost of accessing depth appears to have settled into a higher equilibrium. This is where regime shifts become particularly awkward for practitioners.
Any backtesting model calibrated on pre-April data will systematically underestimate transaction costs going forward. The historical relationship between volatility and spreads, so carefully fitted to the 2022-2024 period, no longer holds. Whether this new regime proves permanent or cyclical remains to be seen, but the lesson is rather pointed: the past is a less reliable guide when the microstructure changes.
This has real implications for how we measure trading costs. Average spread data feeds directly into pre-trade cost models, which in turn shape decisions about execution speed, timing, and algorithm design. The same data informs asset selection and regulatory liquidity reporting under frameworks like PRIIPS.
Choosing the right metric for your trading activity isn't simple. The data is vast with billions of data points daily, expensive to capture, maintain, and refine. But if better measurement saves you €4.4m a year, the investment pays for itself.
Follow us on LinkedIn to stay up to date with the latest series of Liquidity Matters, news and platform enhancements.
Episode 4: Why Expiry Dynamics Matter
Derivatives and equity markets are inherently connected. Index contract expiries drive substantial surges of liquidity into equity markets, particularly during the end-of-day auction on expiry day.
The biggest single liquidity event for 2025 in equities was the closing auction coinciding with Index Futures Expiry on September 19th, €46 billion, equal to an entire day's worth of annualised order book ADVT. This is a regular, deep, and predictable liquidity pool for equity traders to tap into. Open Interest in the FTSE100 ICE contract alone currently stands at over €45 billion.
Open Interest data provides insights into equity flows. It consists of the aggregate position of distinct participant types: CTAs with unhedged exposure to futures prices, real money managers using futures to hedge their underlying equity strategies, delta-one desks and APs managing tracking error and reconstitution, among other activities that keep an index and its underlying in sync. This reflects risk sentiment—higher Open Interest and higher contract volume indicate higher volatility. On expiry, the aggregate position must be closed through the combined actions of participants: offsetting futures positions, rolling into the next contract period, or settling and unwinding any hedge, facilitated by liquidity providers. These dynamics are directly connected to the equity market and trigger very high volumes, especially during expiry day closing auctions.

Figure 1: Z/25 Start of Day Open Interest and trading volume on ICE. June and September OI value was muted; June OI declined steadily from initial rolled value to expiry, while December showed the opposite.
Figure 1 shows the quarterly FTSE100 Index Futures contracts for 2025. 'Start of Day' Open Interest is higher in the first and fourth quarters, apparently tracing market volatility. There's a drop of 60,000 net contracts following the March expiry—indicating a lower roll (c80%) compared to higher roll percentages in the other three expiries.
The direction and persistence of Open Interest is reflected in the average time between the 'peak day' for Open Interest and expiration: 58 days across all contracts, with wide variation from 9 days in the December contract to 77 in the June contract. A higher number implies reducing volatility. Keeping track of this measure indicates potential roll volume and whether Open Interest is building or reducing towards expiry.
The corresponding equity market closing auction volume is another key measure, ranging from €39 billion in December to €46 billion in September as the index is reconstituted at the close.
The Roll pattern is consistent, but timing varies. It normally starts between five and ten days out from expiry. Back-contract Open Interest rises slightly at first, announcing the start of the Roll, which then accelerates fast during the last week of trading. Equity liquidity deepens as participants trade the underlying to stay hedged into expiry day and the 10:15am fixing.
Equity traders can use cross-asset data to monitor trends in the flows and build an additional layer into their liquidity management framework for pre-trade estimation, trading strategy selection, and operational models such as intraday volume curves and close auction prediction. Liquidity deepens at regular monthly and quarterly expiries, creating windows of opportunity for lower-cost rebalancing, transitions, and equitisation of inflows and outflows. This is why the expiries matter.
Follow us on LinkedIn to stay up to date with the latest series of Liquidity Matters, news and platform enhancements.
Episode 5: Alternative Closing Liquidity Matters
Institutional traders relying solely on primary exchange closing auctions for end-of-day trading may be missing out on up to €4.4 billion per day available through alternative liquidity pools. In 2025, 'at close' liquidity accounted for €15.2 billion per day - 22% of market volumes across Europe. Closing auctions accounted for only 16% of market volumes, or €10.8 billion per day. The alternative pools offer up to 29% more liquidity than the closing auction alone.
Why Closing Liquidity Matters
For traders using NAV and MOC benchmarks, the Close represents the opportunity to execute all or part of a trade with zero tracking error, to reduce overall market impact by minimising residual quantities that must be executed before the close, and to avoid gap risk. The additional liquidity pools offer the chance to optimise this opportunity.
Figure 1 shows the daily comparison of all available liquidity (including the closing auction) and alternative pools (excluding the closing auction) in 2025. In the previous episode of Liquidity Matters, we demonstrated how futures expiries drive very high spikes in at-close flows. The subject of alternative liquidity pools also links to these events.

Figure 1: The lower panel shows all 'at close' liquidity pools, including the primary exchanges' closing auction period. The upper panel excludes the primary Closing Auction. The average difference in 2025 was €4.4 billion per day (29%).
Consider a €20 million trade in a liquid stock. If the primary closing auction averages €17 million daily, a 20% participation cap limits primary execution to €3.4 million. The remaining €16.6 million must be executed intraday or through alternative closing pools. Using our headline figures (bearing in mind the ratios change from stock to stock), by accessing alternative closing liquidity pools, the trader can route an additional 6.5% of the overall trade to alternative close liquidity pools, improving execution quality and reducing overnight position exposure. This shift in execution timing directly reduces tracking error to the NAV or MOC benchmark.
Where is the Additional Liquidity Found?
Alternative closing liquidity divides into three categories:
-
Alternative Closing Mechanisms (ACMs): €900 million daily (1.3% of daily volumes)
MTF and exchange-operated electronic platforms execute the equivalent of 8.3% of primary closing volume. These are fully addressable through brokers with the required market access. ACMs operate in two formats: parallel-timed mechanisms synchronised with primary auctions (lower fees, same closing price), and post-close platforms that capture residual quantities after primary price discovery. All execute at the primary closing price, preserving the primary auction as the price-formation venue. - Systemic Internalisation at Close (SI 'At Closing Print'): €2.4 billion daily (3.5% of daily volumes)
Banks and liquidity providers execute bilateral trades at the primary closing price away from order books. - Over-the-Counter at Close (OTC 'At Closing Print'): €1.2 billion daily (1.7% of daily volumes)
This consists of negotiated bilateral closing trades not classified as bank internalisation. These flows typically involve large block trades where price is negotiated directly between parties.
Together, SI and OTC account for €3.6 billion daily, equivalent to 33% of primary closing auction volume and 5.3% of overall daily market turnover. As these mechanisms are bilateral, they are not 100% addressable. Investors gain market access through their broker networks, investment in IOI/RFQ technology, and ongoing relationships with risk providers.*
Implementation: The Critical Questions
Access to alternative closing liquidity requires systematic answers to three questions:
-
Does your broker network provide sufficient execution access to ACMs and bilateral closing flows?
-
Does your pre-trade execution model account for closing volume across all pools, or only the primary auction, and is it properly calibrated at stock level?
-
Does your post-trade analysis capture execution rates across all closing pools?
The answer to these questions lies in an investor’s capabilities in measuring trading volume distribution (for example primary vs. ACM vs. bilateral) and execution quality (for example benchmark slippage) at the level of individual liquidity pools and venues.
Conclusion
The €4.4 billion in daily alternative closing liquidity is not marginal. For trades benchmarked to NAV or MOC, systematic access to these pools can reduce intraday market impact, tracking error, and gap risk.
However, capturing this opportunity requires acquiring, processing, and classifying very high volumes of data at stock level, billions of data points a day. It demands sophisticated pre-trade models and post-trade analytics, and optimised market access, whether directly or through brokers, for ACMs and bilateral flows. Without these capabilities, investors may miss the opportunity to optimise their trading costs.
Follow us on LinkedIn to stay up to date with the latest series of Liquidity Matters, news and platform enhancements.
*Categorisation of off order book trades into bi-lateral buckets requires detailed examination of trade reports. Using the industry standard ‘MMT’ (Market Model Typology) we condense all trade reports by filtering out trades that are reported as ‘non price forming’ or ‘technical’ or with a price that does not precisely match the official close.
Episode 6: Cross Asset ETPs Matter
The ETP ecosystem, spanning equities, commodities, REITs, fixed income and more recently crypto, has become the real-time window into investor sentiment and how capital is repositioning itself across asset classes with varying risk exposures. Trading volumes and changes in assets under management (AUM) reveal sector rotations, assets exposures, and liquidity constraints as they happen.
This granularity has the advantage over mutual fund data, which suffers heavy time lags. Unlike quarterly mutual fund surveys, ETF flows are timely signals of where capital is moving and which asset classes are facing execution pressure. This is an essential tool for determining asset allocation and diversification.
For example, holdings in European Gold ETPs have grown by over 90% since January 2025; silver equivalents have more than doubled. January 2026 revealed increasing bearish sentiment on the metals and concerns about an AI bubble (gold and silver are used heavily in chip manufacturing) which triggered an historic 44% drawdown in silver and a 15% temporary slide in gold prices. Figure 1 shows the extreme reduction in asset values in January followed by a reversion to the trend.

Figure 1: Daily Changes in AUM for European Gold and Silver ETPs since January 2025.
Figure 2 shows daily trading activity in European ETPs for equities, commodities and fixed income since the beginning of 2025, with gold and silver growing fast since September 2025, reaching a peak at the end of January. What does this mean for measuring investor sentiment? Traditionally, commodities have been viewed as a hedge against inflation (opinion is divided). But inflation is reducing. Is the longer term connection between gold investment through ETPs a bullish take on the AI revolution, or a risk-off hedge for the bubblists?

Figure 2: Daily Traded Value in European ETPs since January 2025 showing strong growth in Commodities since September 2025.
Pause for thought - both bulls and bears chasing the same asset class sounds like a regime change - volatility caused by the push and pull of different use cases for the asset. This demands careful consideration for portfolio managers using these assets as signals. Even for portfolios that don’t invest in commodities, their prices impact equities and fixed income products. Market volumes help to understand the dynamics behind the price and ETPs represent a powerful proxy for following the trend.
Historic and intraday information on ETF volumes, backed up with creation/redemption information allows portfolio managers to track trends across asset classes over multiple years and granular periods. It can identify sizable institutional switch strategies on a daily basis, and momentum in investor sentiment shifts. It can be used to pick out trends in retail attitudes to risk and help traders understand the rapid evolution in market structure that accompanies the ETP ecosystem. This helps to plan and implement execution strategies and measure execution quality, through the monitoring of trading costs across different venues types such as RFQ venues and lit order books.
Our primary and secondary ETF market data provides insights into peer group rankings, trends in asset classes that support product development and provide deeper analysis into trading and execution strategies. For more information on our ETF data and analytics, contact sales@xyt.one.
Episode 7: Dark Pools and Periodic Auctions Matter - Alternative Intraday Liquidity
Dark pools and periodic auctions now collectively account for 16% of daily European addressable liquidity in 2026, just one percentage point behind closing auctions, as the two mechanisms continue to erode market share from lit order books, which have fallen to a ten-year low of under 32%.
The shift marks a dramatic structural change in European equity trading since the introduction of MiFID II/MiFIR in 2018. Combined, dark pools and periodic auctions have more than doubled their footprint relative to on-order-book liquidity, rising from 9% to 24% over that period. This is a near tripling in share that underscores how fundamentally trading behaviour has changed in the post-reform era.
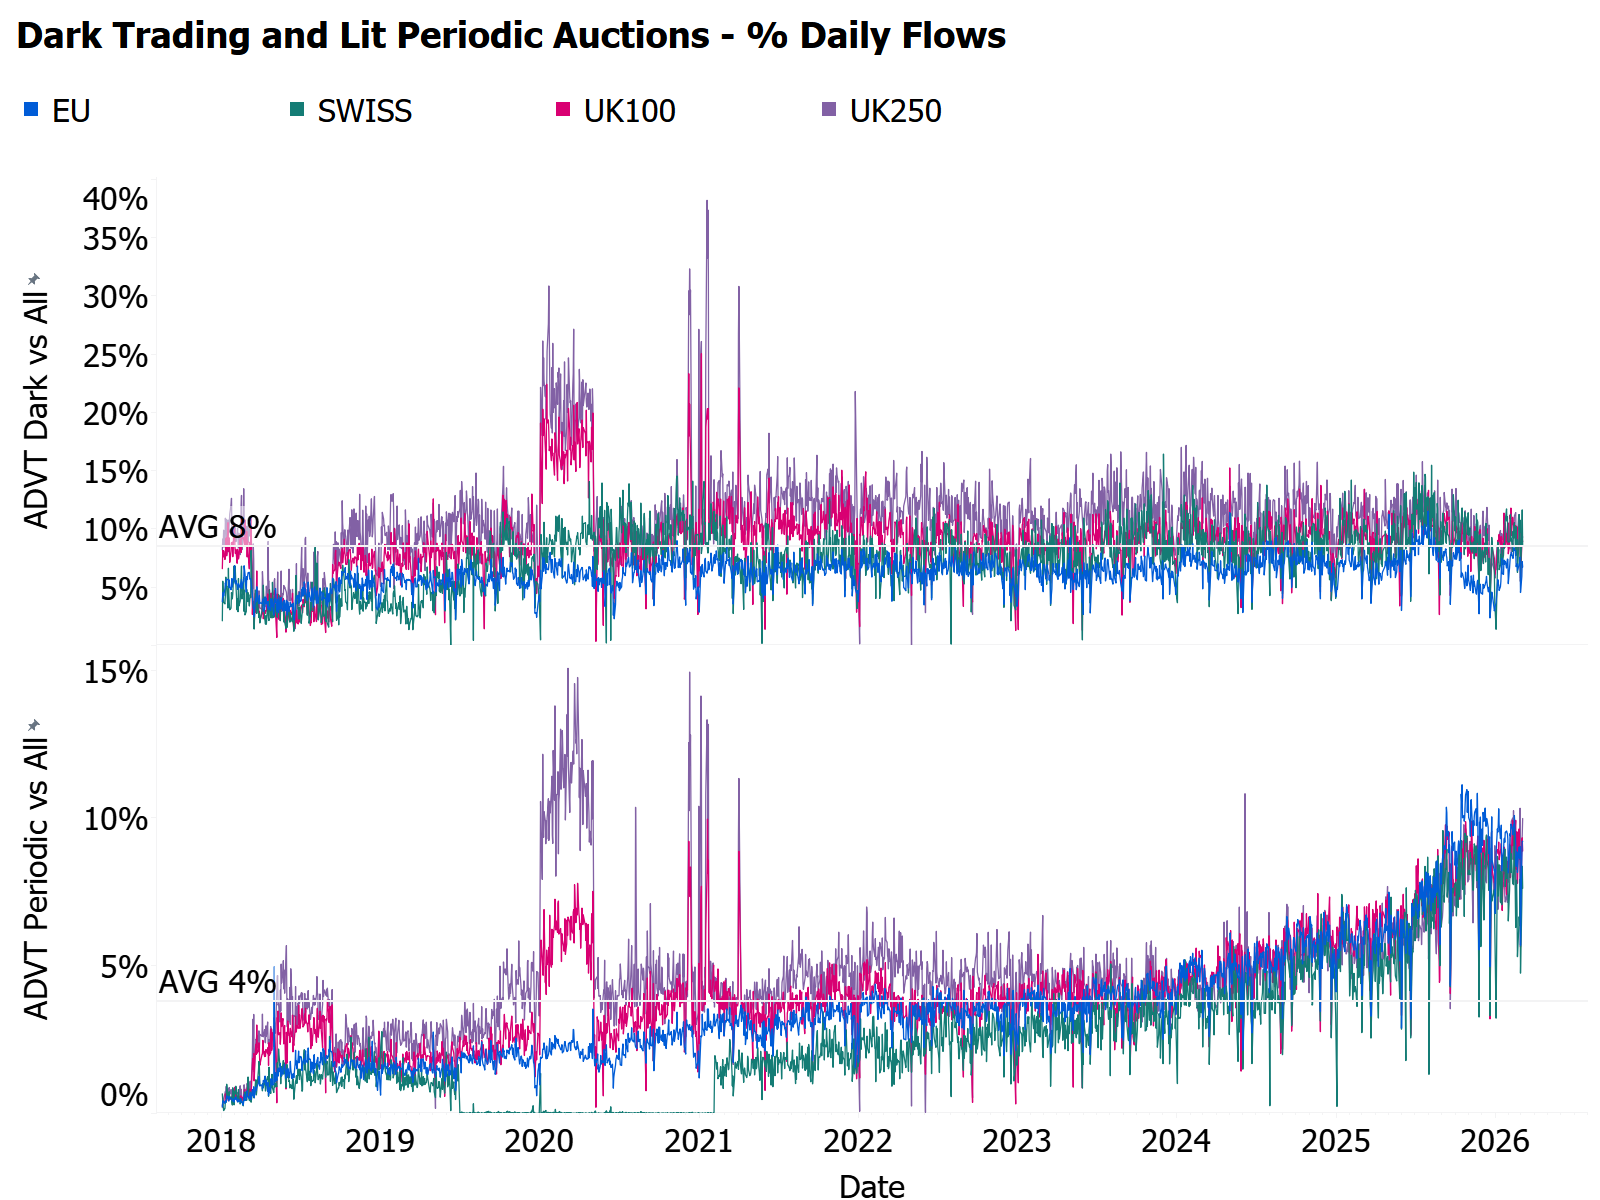
Figure 1: Daily volume traded in UK, Swiss and EU names since MiFIR implementation in Dark Pools and Periodic Auctions
Tracking this shift at the individual stock level is an essential prerequisite for managing intraday trading costs and minimising benchmark tracking error, particularly in the current volatile market environment.
Much attention has rightly been paid to the relentless growth of closing auction liquidity, which has reached €14bn per day in 2026. Yet it is periodic auctions that have emerged as the more dynamic story. Accelerating sharply over the last six months, periodic auctions and dark pools combined have already posted €13bn in daily liquidity so far in 2026, and at the current rate of growth, are on course to surpass the closing auction within the year.
It is this convergence, and the speed at which it is unfolding, that makes venue and liquidity monitoring so critical, and shapes the execution strategies traders need to deploy in order to avoid additional cost in volatile markets.
With trade sizes of up to twice that of the main order books, and showing lower post trade price movement, these venues are a critical source of liquidity for intraday trading, especially for shortfall strategies and aggressive price taking orders. The recent rise of periodic auctions (aka frequent batch auctions) is shown in Figure 1. If you are unfamiliar with the mechanics of these trading venues, some notes are included at the end of this blog.
The effects on the market regime of changing regulation can be dramatic. Figure 1 shows how the implementation of dark caps resulted in over 1,000 names being suspended by 2018, at once - surely a dislocation. The system took a few years to stabilise during which the periodic auctions came of age. The Swiss equivalence reset in 2019 led to a halt in periodic auction trading for 18 months in those names. The FCA dropped the caps altogether following Brexit. UK based names enthusiastically jumped to nearly 15% of daily addressable volume (in the case of the mid caps), before settling back to the only slightly elevated 10% level. The ESMA review implemented lower caps of 7% in October 2025, triggering a fall in the stable level of dark pool trading and a rapid rise in periodic market share.
Geographical and Market Cap Variations
Figure 2: Dark pools only; depicts regional variation: Neither Swiss nor UK regulators restrict trading through caps, and show the highest level of dark pool trading, whereas Italy has the lowest level, mainly due to the local transaction tax which penalises trading away from the lit order book. Differences in local market structure play out in the availability of liquidity.
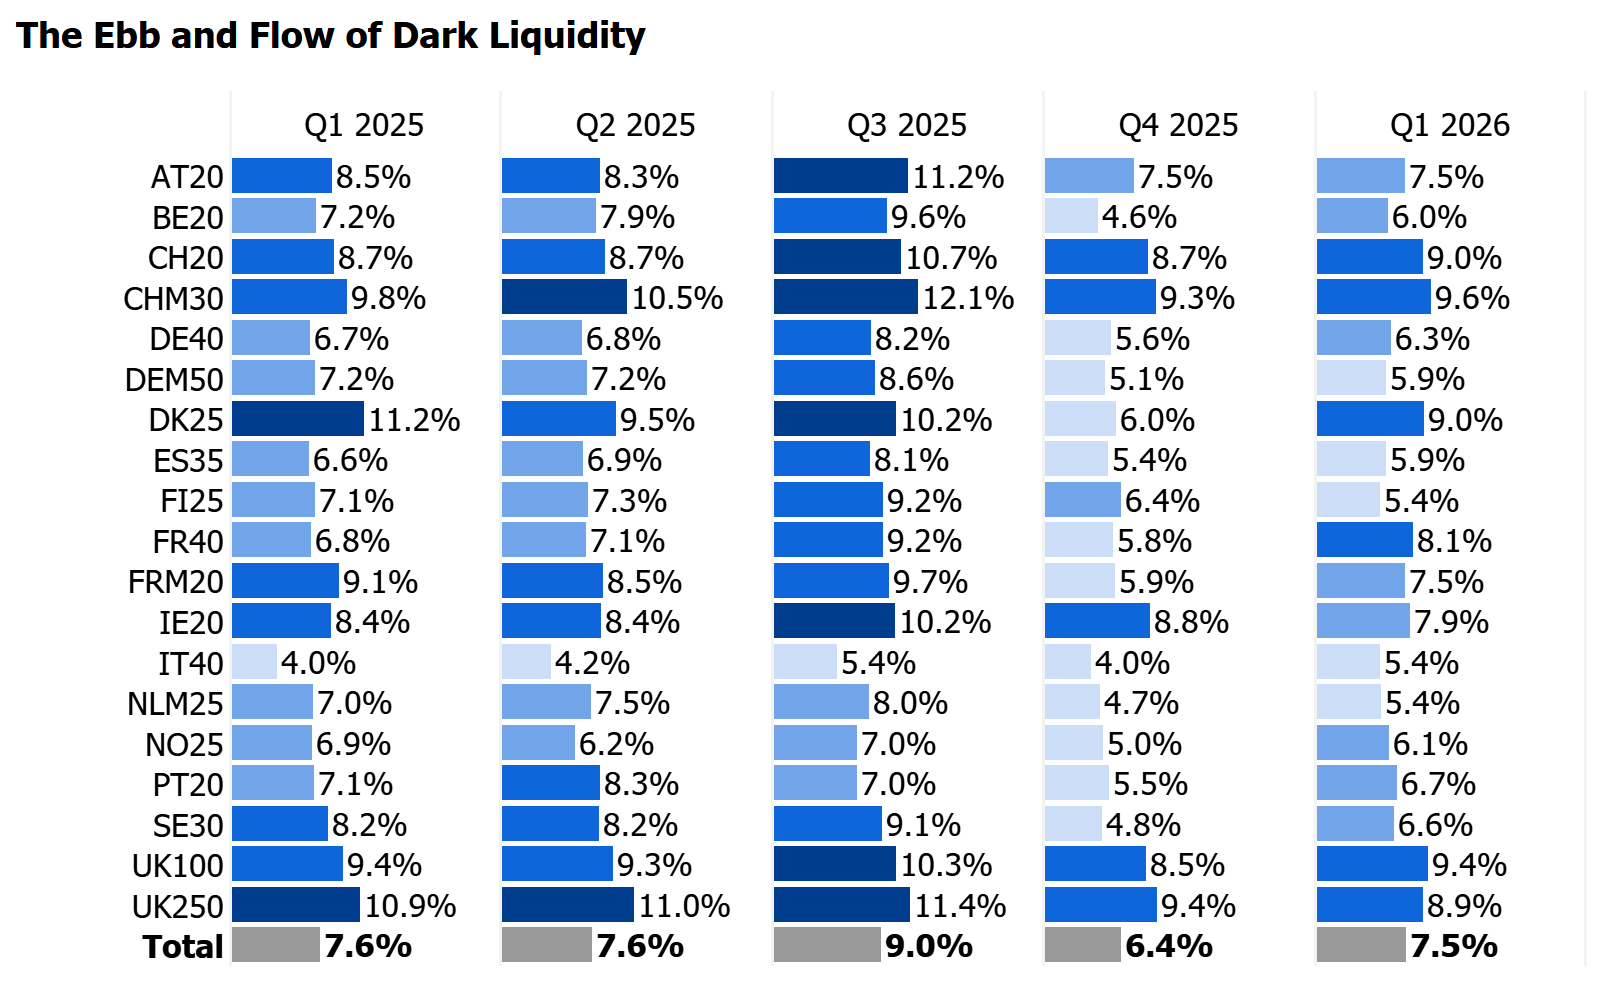
Figure 2: Dark Pool trading as a percentage of overall addressable liquidity from Q1 2025 to Q1 2026 by index. Colour intensity shows the highest or lowest distance from the simple average shown in the grand total.
The graphic demonstrates the importance of measuring the variation and trend in these liquidity pools and not only at country level but for each individual symbol.
Indexes containing M and the UK250 are mid cap indexes and reliably have higher levels than their large cap counterparts. Dark pools are more useful as liquidity declines. Dark pools tend to gain market share when overall market liquidity is lower - as seen in Q3 2025 which was the least liquid quarter of the year.
Reliable Liquidity Prediction
Figure 3 shows strong general correlation between both dark and periodic market share and addressable daily value (ADVT), demonstrating that their liquidity profile is structurally predictable.
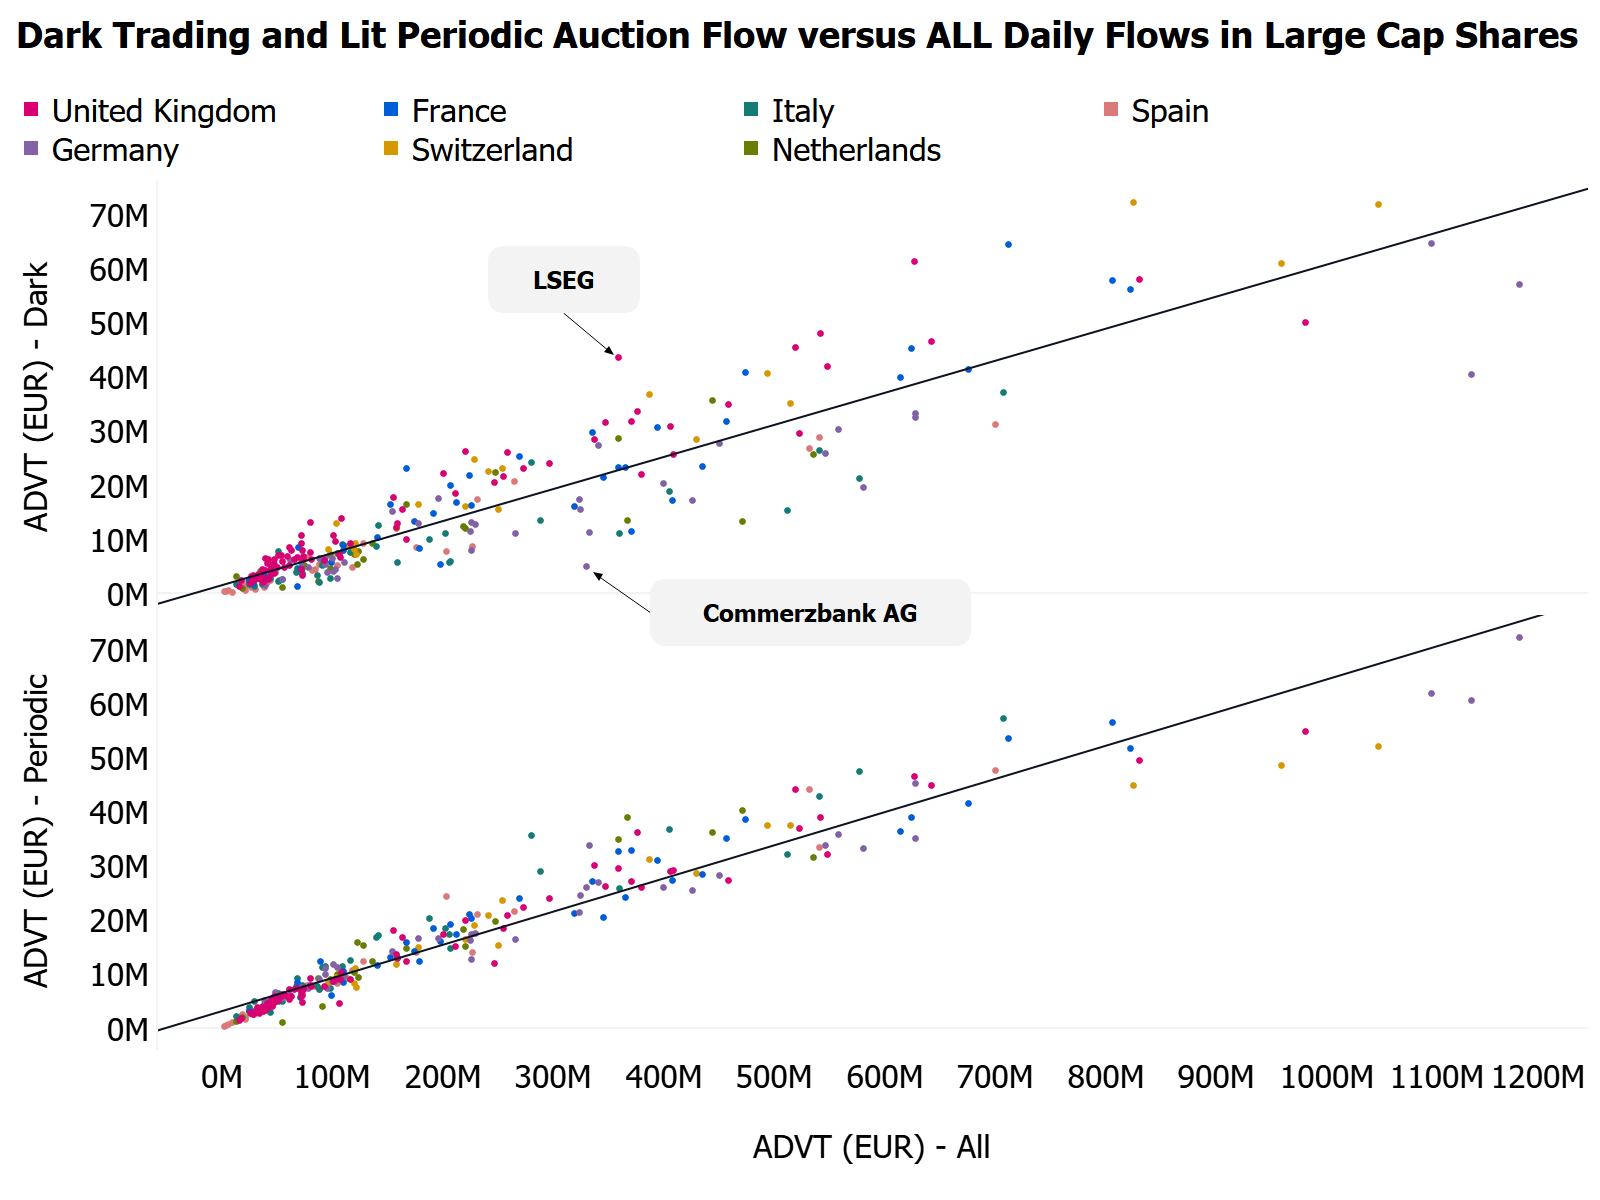
Figure 3: Dark Pool and Periodic Auction ADVT in euros, compared with total addressable market volumes by stock. Colour represents the regional view reflecting different regulatory regimes. Italian names tend to track lower, UK and Swiss names higher.
This chart is for illustration only. The relationship between dark trading and periodic auctions volumes with overall addressable liquidity is nuanced with less predictable volume curves. For example, dark trades can be very large and unexpected, especially when executed in conditional venues and must be controlled for when modelling recent historical volumes and intraday curves.
There is an effect where lower general liquidity leads to an increase in trading through these alternative venues. For execution teams, this predictability has a direct application: pre-trade models used to forecast market impact and calculate optional trading speeds must include these venues. Successful implementation requires data precision at scale as well as relevant metrics.
Conclusion
The intraday market has never been more fragmented. Whether this represents a structural improvement or a deterioration remains genuinely difficult to assess. For more than a year, macro-driven volatility has obscured the underlying microstructure trends, making it hard to isolate cause from effect.
What is clear is that the rapid rise of periodic auctions demands both attention and rigorous post-trade discipline. Pre-trade models must incorporate ADVT-based market share forecasts covering both dark pools and periodic auctions, calibrated by geography, market capitalisation, and individual stock characteristics. Trading distribution should be continuously measured against the market's own distribution, with performance metrics used to interrogate and justify any meaningful divergence.
Model inputs, historical ADV in particular, require regular review. In a microstructure landscape that is shifting as quickly as this one, stale assumptions carry real cost.
Notes on Trading Venue Mechanics.
Dark pools are familiar territory for most people. The technicalities; they match orders at the mid price of the order book with reference to the venue with the greatest share of trading. This is permitted under a waiver to the golden rule of MiFID which is that all electronic trading must be carried out on electronic orders books which publish price and size to the market at all times on a pre trade basis. The exception is called the ‘Reference Price Waiver’ (RPW) and was initially set by the regulators to an average of 8% of all daily volume over a 12 month period. This was changed in September 2025 to 7%. Should this cap be exceeded all dark venue operators must suspend trading in the affected name for six months. The mid cap restriction is a reason why dark volumes in Europe are much lower than in the US, where trading venues are permitted to execute trades at any price at or inside the touch.
A further exception to the RPW rule is available for orders above a certain ‘Large In Scale’ (LIS) threshold - normally more than €1m. Under the LIS waiver, if a symbol is restricted by the cap, a dark venue may admit orders that are above this threshold. These trades are included in the data shown in this episode. Yet another exception is that SI trading may execute orders of any size electronically.
Periodic auctions may be less familiar. They are ‘mini auctions’ operating at intervals ranging from 100 milliseconds to several seconds depending on venue rules. By publishing indicative uncrossing volumes and prices in real time and without being pegged to other lit trading venues they are considered price forming and therefore considered ‘lit’ and therefore survive any RPW caps and are not concerned with LIS rules. Orders execute according to time and price priority, with collaring to parent venues prevailing bid-offer applied to protect best execution rules.
Adding the market share of dark pools and periodic auctions puts European trading more or less in alignment with the market share of dark pools in the US.
Follow us on LinkedIn to stay up to date with the latest series of Liquidity Matters, news and platform enhancements.
Episode 8: Implicit Trading Costs Matter Part 1 - Cost Dynamics
Implicit trading costs make up the greatest share of execution costs for investors. These costs depend on several factors such as trade timing and tactics, including the choice of liquidity pool and trading venue. For the most liquid French stocks in YTD2026, the lit book mid price moved by an average of 1.47 bps within one millisecond of a trade, illustrating the immediate contribution to trading costs of price sensitivity to trading activity.
After five minutes, that change was up to 16.39 bps. On a €50mn basket, this translates to a cumulative unrealised cost or saving of up to €81,950 to the portfolio, depending on the basket’s positioning versus price trend.
As discussed in Episode 3 of Liquidity Matters, relying solely on the 'at-touch spread' gives an incomplete picture of trading costs. It captures explicit costs, such as venue and settlement fees, but only a small fraction of implicit costs (see Notes section for an explanation of implicit cost). For the most liquid French stocks, half the at-touch spread is around 2 basis points, which represents only 12% of the cost measured from the mid price at execution to the mid price five minutes later.
To discover the full cost of a trade, a broader measurement timescale is needed. By using pre and post trade ‘mark-outs’, we can accurately measure the key components of implicit trading cost contributors such as market impact and adverse selection throughout the life of a trade. Mark-outs are the differences in the market mid price between the time of each print and a series of time points before and after - it’s an ‘MRI scan’ of the parent trade.
.svg)
Figure 1: The FR40 chart displays absolute price changes to the PBBO mid price at various time offsets (‘mark outs’) before and after execution, in milliseconds. Each line represents the change in the PBBO prior to and following a trade reported by the given type of liquidity pool. For example, the purple line shows the reaction of the PBBO to dark pool prints. The series converges at execution offset=0 and diverges post-trade.
A price reverting market will reduce the mark-out values as price returns towards its original level following trading activity, whereas a trending market will increase them during a change to fair value. These measurements form a key role in post trade analysis and a major factor in explaining benchmark performance and the assessment of trade timing and tactics such as liquidity pool and limit price selection.
Figure 1 shows the immediate change at the 1 ms mark-out of 1.47 bps in the Lit Order book after execution. This reduces to 0.15 for a dark pool, appearing more attractive at the one-millisecond mark. However, over five minutes, the cumulative cost reverses: dark pools reach 16.39 bps versus 14.39 bps for lit pools. The evolution matters as the initial cost advantage of the dark pools appears to erode as price momentum unfolds.
Note that these numbers are absolute. A buyer in a moving market ‘wins’ a discount for trading early in a rising market, assuming the new price holds. A seller has paid a premium. This illustration is highly generalised but forensic analysis of an investor's own trades (with side included) can use mark-outs as ‘micro benchmarks’ to test whether the trading tactics are more or less efficient than the market average throughout the life of a trade, and measure aggregate impact.
Not every trade results in a change in price, which explains why the immediate mark-out is less than half a spread. A well balanced order book with a thick queue is less volatile than an unbalanced order book with a thin queue. The latter will result in faster, larger movements in price reflecting volatility and liquidity imbalances. Therefore mark-outs provide deep insight to the prevailing liquidity quality during a trade. While not shown here, mark outs to the closing price on T0 and for several days before and after a trade help explain how much trading cost is associated with general and exogenous movements in a stock and its relationship to comparables in an index.
Liquidity Pool Differences and Venue Selection
In the next episode of Liquidity Matters we will dive into the differences in behaviour between types of Liquidity Pool. For illustration, Figure 1 demonstrates how using different types of liquidity pool can impact and reduce short term implicit trading costs. There is a strong convergence of price impact after five minutes suggesting that venue selection has only a short term effect.
Most notably, the graph reinforces how trading in alternative venues can reduce short term implicit trading costs at the 1 ms mark-out - by 1.3 bps for dark pools and 1.43 bps for periodic auctions). Unlike dark pools, periodic auctions retain a small discount to the Lit Order Book mark-out as price evolves. This reflects the growing popularity of periodic auctions, as highlighted in Episode 7.
Conclusion
The mark-out framework built around observing mid price movements before and after a trade provides the precise measurement of execution costs that spread-based metrics alone cannot capture.
- Pre-trade mark-outs assess whether an algorithm's directional predictions and trade timing decisions were sound.
- Post-trade mark-outs reveal whether trading tactics suffered from short-term market impact and price reversion, or successfully captured a premium ahead of a shift in fair value.
The scale of this is significant. A strategy that executes at mid in French large caps could pay or retain up to 16.39 bps on average in the five minutes per print.
A strategy that is well-tuned to market microstructure, uses alternative venues, deploys agile order placement logic, and accurately predicts short-term price direction, will maximise this benefit or minimise the cost.
The mark-out dataset is one of the most powerful tools available for determining whether your execution is capturing fair value or surrendering it to the market.
Follow us on LinkedIn to stay up to date with the latest series of Liquidity Matters, news and platform enhancements.
Notes on types of Implicit Costs.
Effective spread cost: This is half the prevailing spread at the time of a trade, and is the premium paid to a liquidity provider for immediacy. It varies according to volatility and market concentration/competition. Because the spread embeds explicit trading and settlement fees, implicit trading cost can be detected by looking at the general trend in the effective spread. This is shown in Liquidity Matters Episode 3 - “Why Spreads Matter”.
Market Impact: Using the analogy of the buyer, if the buyer is large in size, and is alone in the market, price is likely to fall back (revert) to fair value when the trade is completed. Such a trade has temporary market impact and the initial premium will be eroded, potentially to become a cost. This is valuable liquidity for counterparties. If the buyer is part of a group of traders who are large in size this implies a momentum trade where a new fair value is set and the buyers together have induced permanent market impact.
Adverse Selection: This type of cost affects passive trading. Entering orders onto the near touch may attract an immediate benefit, but if the price ‘moves through’ the near touch then that benefit becomes a cost. This is a risk for passive traders who hold their position when market momentum is against them, and there is no fair price reversion but a way to capture spread when price is stable. This is especially true when high order routing latency means market orders join the order book at the back of the queue or when orders are placed to jump the queue by making a new best price which is then unsustained. Measures of queue position complement mark-outs analysis to help optimise trading tactics accordingly.
Episode 9: Implicit Trading Costs Matter Part 2 - Liquidity Pool Mechanics
Intraday market volumes are fragmented across five main liquidity pool types, each with distinct cost characteristics, creating a complex picture of relative trading performance.
The European market comprises 24 country primary exchanges and MTF lit order books, more than 30 dark pools, periodic auction venues, and integrated market mechanisms, and hundreds of bilateral inter-participant connections. We combine this mosaic into five main categories, and this episode examines each type of liquidity pool, on and off the electronic order books using the mark-out methodology described in Episode 8 of Liquidity Matters.
Our benchmark, shown in Figure 1, is the observed, absolute, weighted average change in the mid price at a series of mark-outs before and after a trade in a given venue type. For lit continuous order book trades (blue line) this is 2.93 bps at one millisecond and 14.78 bps at five minutes.
Measured over a five-minute window, off-order-book bilateral Negotiated Trades (in yellow) show the lowest implicit costs. For the most liquid UK names (UK100), this pool records 4.72 bps versus 14.78 bps on lit order books, a 68% cost advantage of nearly 10 bps.
This reflects the market-neutral nature of balanced block trades: price impact only emerges when one counterparty is substantially larger and continues seeking liquidity elsewhere.

Figure 1: Implicit trading cost measured by changes in market price - ‘mark-out’. The change in price is calculated as the difference between the Primary BBO mid at t=0 (time of trade report) and at t=n (a series of offsets in milliseconds) throughout a ten minute window from five minutes before to five minutes after the trade report for the given venue type. Longer mark-out series, including multi day are also available.
Periodic auctions (in purple) carry the lowest market impact among on-order book venues with immediate mark-outs of 0.3 bps, rising to 13.58 bps at five minutes, 8% less than lit continuous order books. This may be contributing to the finding in Episode 7, that periodic auctions have become the preferred alternative for intraday trading.
The frequent batch mechanism repeats auctions at short intervals throughout the day, attracting aggressive orders that capture spread and passive orders that bypass the lit queue, without requiring ultra-low-latency infrastructure. Execution probability has historically been lower, but rapid market share growth may now be creating a virtuous circle.
Dark pool trades (in pink) are pegged to the mid of the most liquid reference market BBO, incurring a half spread cost of around 3.5 bps for UK100 for passive orders, or saving half a spread for aggressive orders. In isolation, the originating order creates no impact on the market mid-price because it does not interact with orders on any lit order book. However, the trade report signals intent to the market. Regular or larger dark pool trades amplify this signal, particularly when combined with parallel lit order book trading.
The mark-out data reveals the consequence. At one millisecond mark-out, dark pool trades show 1.38 bps of cost - 47% of the equivalent for lit continuous trades. But, unlike the other liquidity pool types, this advantage does not persist. After one minute, the position flips, and by five minutes, dark pools reach 16.01 bps compared with the lit order books 14.78 bps - 8.3% larger. This reversal reflects the larger average trade sizes in dark pools, which are further skewed upward by conditional venues where order sizes must be above €1m.
Liquidity pools are closely linked. Small sized dark pool trades may execute with minimal price impact, much as on lit order books. A large buyer or seller, however, may exhaust dark pool liquidity and must continue seeking supply in lit venues, thereby transferring market impact to other venues. Market impact is contagious.
Systematic Internalisers (SI) (in green) are the fifth liquidity pool represented. Approximately one third of SI trades are automated, executed at trade sizes comparable to lit orders and informally pegged to the EBBO with almost no initial mark-out. This shows the nature of off order book SI electronic trading pools, which report their trades almost instantly. They don’t move the market because they do not interact with the Lit order book and are normally reported at or inside the EBBO.
Larger SI trades that are filled from facilitation and central risk books, often with some manual intervention, are subject to a one minute reporting window. The mid-price drift at the 60 second mark-out reaches 4.87 bps compared to 7.76 bps for the Lit order books (saving 37% in implicit costs) and 8.71 bps for the Dark order books. For a breakdown of off order book trade size analysis, refer to Episode 2 of Liquidity Matters.
Figure 1 also shows the most liquid Madrid listings, in the ES35 index, where mark-out results differ significantly across all liquidity pool types and time horizons. This difference reflects network and infrastructure latency. The primary market matching engine is based in Madrid, while most MTFs are physically located in London - a distance of over 1,260 km. As a result, the primary market lit order book price updates approximately 9 milliseconds later than the UK100 equivalent in response to a trade on an MTF dark pool. The UK100 and ES35 data are not directly comparable as the names have different liquidity profiles, but the systematic delay shows that lit order book market prices that are further from the MTF matching engines incorporate prices from other liquidity venues more slowly. Even though it is tiny, it is long enough to make a difference to price formation.
Conclusion
Post-trade mark-outs reveal implicit trading cost differences across types of liquidity pool and individual trading venues. Every stock and venue has distinct characteristics. Latency varies across geographies. Market conditions change. The mark-out dataset is complex to create but powerful in helping to measure execution performance by investigating the contribution of every fill to overall benchmark slippage and identifying elements that lead to the best and worst performing trades.
Regular and frequent measurement of fill level performance provides feedback into strategy selection and routing tactics (such as venue prioritisation, limit selection, sizing and order book join speed). Pre-trade applications help optimise market impact estimates and trading speed.
Follow us on LinkedIn to stay up to date with the latest series of Liquidity Matters, news and platform enhancements.
Episode 10: Does Latency Matter?
As shown throughout the Liquidity Matters series, price discovery in fragmented markets is challenging. Liquidity and prices emerge from many sources. Even finding and reacting to the best price across fully transparent lit order books requires technology capable of operating at the microsecond level. Prices diverge and realign as participants compete across the primary country exchanges and three main MTF order books to capture spread. A price change that narrows the EBBO spread on the LSE is fully reflected on the MTFs within 300 microseconds, for 60% of occurrences. For Euronext Paris, this takes 3,600 microseconds. For Madrid, 9,700 microseconds. Other countries fall between these points, and the effect is symmetrical - the same lag occurs on an exchange when a new price originates on an MTF.
When an order appears on a lit trading venue that improves the bid or offer shown across all lit trading venues, it sets a new EBBO. This occurs when a participant seeks to capture aggressive counter-directional orders by starting a new queue on a better price level. If other participants view the new price as fair, they may join the new queue on the same order book or start a new queue on an alternative lit trading venue. The alternative venue therefore ‘regains’ the EBBO. If no other participants react to the new price it will fade, meaning that EBBO regains don’t happen in every case, and materialise at different speeds. This can be a measure for the market’s conviction at the new price. This is price formation in action - where participants and liquidity providers propagate prices across fragmented infrastructure.

.svg)
 Figure 1: EBBO Regains for most liquid stocks listed on LSE, Paris and Madrid in microseconds. An EBBO Regain is where an MTF ‘catches up’ with a new price shown on the primary exchange. The chart shows the cumulative latency of the regain per bucket in 100 microsecond increments.
Why is there a difference between the latency of EBBO regains for London, Paris and Madrid? MTF matching engines are located in London. Primary exchange matching engines either operate in their respective countries or at a hub location for multi-country exchanges like Euronext where the data centre is near Milan. The difference is largely dictated by distance. The Euronext matching engine operates approximately 950 km from London; Madrid's primary engine is ~1,250 km from London.
Speed of light transmission contributes approximately 6,250 microseconds one-way from Madrid to London. For Madrid, 60% of regains complete within 9,700 microseconds, with difference in time generated by venue matching engines, network infrastructure and the decision making process of electronic trading and quoting algorithms as they decide whether and where to change a quote. Without the geography involved, the figure of 300 microseconds for London indicates the astonishingly low latency at which the market reacts to new information on price.
Although latency differences are tiny, they affect routing decisions. Consider a smart order router that sends a passive limit order to wait in a queue on one order book, only to see a better price appear elsewhere, setting a new EBBO. The router faces a decision: does it cancel and join the new queue? By the time the router reacts, the new queue is likely to be longer. Missing execution by staying increases the risk of needing to pay the spread to catch up.
For dark pools specifically, regulation requires execution strictly at the mid-price of the reference venue, (typically the primary exchange) with highest traded value. The dark pools operate as MTFs, and are mostly also based in London. Latency in EBBO propagation means dark pool trades may not execute precisely at the current EBBO mid-price, particularly for distant primaries.
Conclusion
We showed in Episode 9 of Liquidity Matters that implicit trading costs measured through mark-outs differ substantially by listing location, with particularly notable differences for dark pools between London and Madrid. EBBO propagation latency substantially explains these differences. The ~1,250-kilometer distance from Madrid to London creates an ~6,250-microsecond floor from physics alone, with additional infrastructure and processing latency bringing total EBBO regains to ~9,700 microseconds for 60% of updates. London's colocated structure reduces distance, resulting in 300-microsecond EBBO Regains - indicating latency due to ‘decision making’ speed.
This is a structural feature of current European market design. Participants operating across geographies manage the challenge through algorithm precision and sophisticated order routing. Measuring execution quality must distinguish between performance due to decision making, data quality and routing logic versus raw geographic latency effects. High granularity, nanosecond data lies at the heart of the solution to this challenge.
The introduction of a Consolidated Tape this year will establish an official EBBO of record. The aim of the initiative is to reduce the cost and effort involved in monitoring price formation and checking adherence to best price on a post trade basis.
Episode 11: Shining the light on retail flows
Are Europe's Retail ETF Investors Getting a Fair Deal?
Retail participation in European ETFs has never been higher. Total intraday retail trading in the top 10 European ETFs has so far this year exceeded €24bn, and that is just for trading on electronic venues. This flow is sourced primarily from an expanding number of ease-of-access wrapper account providers. So-called 'neo-brokers' are lowering barriers to entry, and passive investing has become a retail habit. Exchanges are introducing new trading mechanisms to improve efficiency and liquidity.
But as more retail money flows into ETFs, a fundamental question poses a significant data challenge: how good is the execution quality experienced by consumers? We find that 53% of retail trades for under €50,000 in the top 10 most liquid ETFs receive price improvement when benchmarked using the Primary Best Bid Offer (PBBO), while 80% receive the touch or better. But that still leaves 20% traded at a premium to the PBBO.
The transparency challenge
Under MiFID II rules, brokers are obliged to deliver best execution for their client. But the definition remains subject to interpretation. For institutional flow, the measurement tools, governance and processes are well established. But retail execution quality is an area where the industry has been reaching for clarity in the past few years. Retail trading does not benefit from comprehensive venue access and smart order routing in the way that institutional trading does, and the microstructure is not consistent across regulatory jurisdictions (for example there are many regional platforms available in Germany for Xetra based listings, while the Retail Service Providers network adds a UK nuance). ETFs represent a particular challenge as the same asset is tradeable in many different countries.
The problem is not that the data doesn't exist. All trades leave their footprints. The challenge is connecting them to meaningful context. Does the answer change depending on the size of the trade, the liquidity of the ETF, or the time of day? How do we handle reporting time lags and price propagation lags across alternative venues? By using the primary exchange's PBBO as a benchmark to study execution quality, we can cast light on these questions.
Matching trades to quotes
The methodology behind our Retail ETF Execution Quality analysis is conceptually straightforward. By analysing trade reports in microscopic detail, we identify retail-sized trades across European ETFs and compare each execution price against the prevailing best bid and offer on the primary listing exchange (the PBBO) at the moment of the trade.
Figure 1 illustrates this methodology. Every trade is classified into one of five categories:
-
Above Offer or Below Bid; the investor paid a premium for the trade, possibly because the order exceeded available liquidity at touch
-
Within Spread; the investor received price improvement relative to PBBO
-
At the Offer or At the Bid; the investor sold at the primary bid or bought at the primary offer.
By segmenting this analysis across trade size thresholds, we see how execution quality varies with order size. This is a critical dimension, since smaller orders should enjoy higher price matches to the PBBO.
.svg)
Overall, the analysis reveals that 80% of traded value is executed at touch or better, and 53% is executed with price improvement. Intriguingly, the proportion of execution outside PBBO is similar across the trade sizes, implying that trading on non primary venues may be systematically outside of the PBBO. It is the 20% of traded value outside the touch that requires deeper analysis.
Deep Dive on SWDA - The Most Traded Retail ETF
Analysis on the widely held iShares Core MSCI World USD (SWDA) is shown in Figure 2, using 2026 trading data.
We measure the trade-to-quote distance meaning how far the execution price was from the relevant side of the primary market quote expressed in basis points. A positive 'distance' means price improvement and a negative distance means the investor paid a premium. The analysis assumes that retail orders are inherently spread crossing and that passively placed orders (such as stops) will execute at the top of the book in all cases.

Most retail trades execute at or within the primary spread; 99.4% of all retail trades of value €100k or less execute within the primary spread. Trades of €5k or less make up 89% of all retail trades and receive between 0.25 and 0.3 basis points price improvement. This picture is stable for trade sizes up to €50k and even up to €100k the slippage is only 0.16 basis points on a value weighted basis.
Execution quality is not uniform across trade sizes. How is it possible for there to be any trades executed outside the PBBO? The answer is that not all trading venues match the PBBO so that some trades, and especially larger trades, execute at a worse price. Just as with institutional orders, it is vital to monitor trading performance across all available liquidity pools to comprehensively monitor price quality.
These patterns are not unique to SWDA. They repeat, with variations, across the European ETF landscape. The shape of the curve changes with liquidity, asset class, and trading currency, which is precisely why a systematic, data-driven approach matters more than anecdotal observation.
Why this matters now
Several industry trends make this analysis increasingly relevant.
The Payment For Order Flow (PFOF) debate has sharpened scrutiny on retail execution. With payment for order flow banned or restricted in several European jurisdictions, the conversation has shifted from "who is paying for your order flow" to "what quality of execution are you actually receiving." Data-driven answers are now expected, not optional.
Brokers need evidence. Best execution policies are only credible when they are backed by measurable outcomes. A broker claiming to deliver best execution for retail ETF orders needs to demonstrate it, ideally with independent, venue-level data that goes beyond their own internal reporting.
Investors are paying attention. Retail investors today are more informed than any previous generation. They read about spreads, compare broker offerings, and ask pointed questions on forums and social media. Execution quality is becoming a competitive differentiator.
Conclusion
Retail investors have greater market access than ever before and greater access to investment information than ever before - not always of the highest quality. Consumers are managing their pensions and investments through electronic platforms. Execution quality and trading cost matters as much to this segment of the market as for institutional investors.
Our example shows the power of forensic analysis for retail trading which can be applied systematically across the full European ETF market - covering the LSE, Euronext, Xetra and all other primary exchanges, regional exchanges and alternative venues, spanning thousands of ETFs across equities, fixed income, commodities, and thematic exposures.
Venues, brokers and market makers now have the tools to demonstrate the quality of their retail execution with independent, verifiable evidence. In an environment where regulatory obligations and commercial credibility demand transparency, that evidence base is no longer optional.
If you'd like to explore the Retail ETF Execution Quality dashboard or discuss how it applies to your flow, get in touch.
Episode 12: Retail ETFs; Venue Selection Matters
As we noted in the previous episode of Liquidity Matters, European retail trades in ETFs execute at or better than the reference Best Bid Offer ‘BBO’ on 80% of occasions, normally by reference to the venue of the main listing. By value traded, this is a similar proportion and 53% of traded value executes inside the spread. To investigate where the 20% shortfall arises, we look at individual venues and find that only five achieve the benchmark for 100% of value traded which collectively account for just 6% of value traded. The remainder range from 85% to as low as 14%.
We took the top 10 most actively traded retail ETFs for the last 60 days, and classified every execution from the last 60 business days as either at, within or outside the BBO market quote. We classed venues with 100% BBO execution rates as ‘Group 1’ and the remainder as ‘Group 2’ or ‘Group 3’ depending on the level of BBO adherence. We ran the analysis across all 16 major European venues, with multi currency ETFs treated separately since currency typically determines which venue acts as the reference market.
Figure 1: Execution quality by anonymized venue. Top panel: turnover (value traded - €Bn. Bottom panel: percentage split, inside and outside BBO.
As shown in Figure 1, the result is not a uniform picture. European venues fall into three distinct groups of execution quality - plus one notable outlier. Group 1 (five venues) achieves 100% of value executed at touch or better than the BBO, Group 2 (six venues) cluster near the 80% mark, and Group 3 (five venues) fall short ranging from just 14% to 74%.
Volume concentration matters
A critical detail: the group structure does not align neatly with venue size. Some of the highest-volume retail venues sit in Group 2, not Group 1. This means that by value, the majority of European retail ETF flow executes on venues where some one in six trades are executed outside the BBO spread.
If the same flow were routed to Group 1 venues would the the proportion executing outside the BBO still be close to zero? The gap between Group 1 and Group 2 is not random, it is measurable, persistent, and significant in aggregate. So why do these gaps arise?
Market model and competition. Venues differ in how they source and display liquidity. Some operate open order books with multiple competing market makers. Others rely on a single specialist and a quote-driven model. The degree of competition for each order directly affects where it executes relative to the BBO quote. There are differences in fee structures, which ultimately may benefit the investor depending on how they are charged by their brokers. Price update lags caused by latency can result in trades executing outside the touch of a remote venue used as the reference BBO.
Reference price mechanisms. Some venues are required by regulations to execute within the spread of a reference exchange. Others make no such commitment. And even where a reference price rule exists, the definition of "within" and the handling of edge cases - stale quotes, fast markets, after-hours sessions - differ between venues.
What this means for brokers
Under MiFID II, brokers carry the best execution obligation. The choice of execution venue is a core part of that obligation, and the data shows that not all venue choices deliver equivalent outcomes.
For brokers routing retail ETF flow, the question is concrete: in which group do your selected venues sit?
This does not mean one venue is categorically "better" than another. Total cost of execution includes fees, settlement costs, speed, and certainty of execution alongside price. But price relative to the reference market is the single most visible dimension for retail orders, and the data shows clear, consistent, and tiered differences.
Conclusion: Why independent measurement matters.
Venues publish their own execution quality statistics, and brokers produce their own best execution reports. But these are, by definition, not independent. A venue has every incentive to present its execution quality favourably. A broker is motivated to justify their routing decisions.
Our data shows a cross-venue, independent view that applies the same methodology to every trade on every platform - using the BBO market quote convention as a consistent benchmark. That is what this analysis provides.
The three-group pattern we observe is not a judgement. It is a measurement. And in a market where retail participation is growing and PFOF is banned, and best execution obligations are under increasing regulatory scrutiny, independent measurement is what the industry needs most.
Follow us on LinkedIn to stay up to date with the latest series of Liquidity Matters, news and platform enhancements.
Episode 13: Volume Curves and the Fragmented Market
Across the 20 trading days of April 2026, orders in the top 40 French names confined to the central limit order book were exposed to just 44.5% of available intraday liquidity (excludes the closing auction). The remaining 55.5% was spread across systematic internalisers (19.5%), dark pools (14.2%), periodic auctions (11.0%), off-book trading (9.7%), the opening auction (0.6%) and combined intraday auctions (0.4%). This aggregated view belies extraordinary complexity beneath. As our focus is on the intraday trading period, Closing Auctions are excluded.
Volume curves provide essential intelligence for managing market impact, and therefore trading cost, by offering a roadmap for spreading larger trades over several hours. That roadmap is not just a schedule but a guide for navigating fragmented liquidity in a market with up to five lit continuous order books and associated periodic auctions, over ten dark venues of various flavours, and dozens of bilateral electronic and manual connections with varying levels of addressability - for every stock. To optimally capture liquidity, an order needs to be in all places at once, and in the right size.
Try exploring the dataset for individual days. Hover over the chart to see the values for each bin.
Figure 1. Our sample shows the 20 day ADVT in €, and the distribution of trading across the eight types of liquidity pool included (excludes closing auctions). The top panel shows the typical shape and distribution of liquidity across the day. These properties are remarkably predictable but with some impressive and random exceptions. The unknown is the level of the curves on a day to day basis, which as we have seen in recent weeks varies according to volatility and newsflow with liquidity events such as block trades causing random deviations in the roadmap.
The dual chart captures two distinct stories. The upper panel shows the 20 day average value traded across the session in five minute bins, confirming the familiar U-shaped profile; elevated at the open, compressed through mid-morning, and building into the close. The lower panel shows the average composition of liquidity at each five-minute interval, built from a total of over 18,000 datapoints. The shape of the distribution, and the relative proportions between the categories, holds with notable stability throughout the session and with statistical significance.
The opening auction captures on average 21% of liquidity during the first five minutes of the day, with unpredictable delayed auctions sometimes extending this event, and with the auction share of the first five minutes ranging from 12% to 30%. This illustrates that the market open (in broader terms the first 15 minutes of trading) is dominated by liquidity pools other than the auction itself. This is the moment for the biggest systematic contribution to liquidity by conditional dark pools for the day. These venues capture large electronically matched block trades with on average 20% of flows in the first five minutes - matching the size of the opening auction itself. The first five minutes of the day, often maligned for its volatility, is on average the most liquid interval of the intraday session, excluding the closing auction.
It is observed that the average value of dark trading through the day is 14.2% - well above the 7% limit imposed by the regulators - the ‘volume cap’. There are two reasons; the denominator used for the cap includes the closing auction and ‘after hours’ prints - both excluded here. Secondly, the dark trading category contains trades resulting from ‘large in scale’ block orders, that are exempt from the volume cap. We will look at a classic example of this in a moment.
While the open may be the ‘quietest’ time of day for the systematic internalisers they largely track the lit order books with striking consistency, rising from around 8% at the open to approximately 20% by 09:25 and holding that level for the remainder of the day. This reflects the electronically driven nature of internalisation where pricing and capacity is directly conditioned on lit market activity, sometimes with significant boosts from block trade reports. An important caveat for any off order book trading is that the mechanics of the trade reporting rules can give the impression of amplified liquidity due to late trade reports and double counting.
As noted in other episodes of Liquidity Matters and our recent review of Q1 2026 microstructure, periodic auctions hold a steady and substantial share throughout the day, at 11% of intraday flows, which since September rivals the dark pools, and with presence in every time bucket.
While the 20 day average is typically used as a standard for algorithms, it masks substantial day to day variations that underline the scale of the challenge in constructing and maintaining these curves (a daily and intraday exercise).
-3.svg)
Figure 2 shows the equivalent data for a single day, April 15th in the same French names when some impressive bursts of trading showed up in the dark trading venues with a beat approximately every hour - commencing with two of almost perfectly matched sizes (€180M each) and indications of connections to related SI blocks visible at 11.45. To put this in context, a 10x spike in dark trades can be expected once a day for this dataset so for four events to turn up in a single day is unusual.
This points to several large French names concentrated into the dark venues at several points over the day reflecting a substantial liquidity event. Hermes International led the way with €1.45bn in total for the full day (2.3x its average for the period) and €176m in the dark pools, clearly contributing significantly to all liquidity pools.
This episode underlines the randomness when the market departs from the average curves and underlines the need for dynamism on an intraday basis - both to identify inflection points in the curve and to identify when to ignore large blocks while monitoring liquidity distribution. Comparing the average to the daily in real time is an important signal for liquidity availability - particularly relevant for implementation shortfall strategies seeking to be opportunistic during favourable bursts of liquidity.
While the statistics show that the general shape of the curves and liquidity pool distribution is on average reliable, the daily picture on a volatile day such as this also shows how dynamic an execution strategy needs to be to stay on track. Variation increases during volatile events, and - crucially - reliability reduces as shares become less liquid. The data is typically fat tailed, reflecting the large and random events such as Hermes International on April 15th. But as we have shown, liquidity tends to revert to the shape of the standard curve quite quickly.
Conclusion
Volume curves matter because trading schedules need to be predictably accurate. They encode both the schedule and the distribution of liquidity across its multiple dimensions simultaneously. The eight aggregate categories illustrated here are only the beginning of the picture. Every stock has its own profile, distributed among dozens of electronic venues, each with their own profile. Engineering and maintenance of these curves, consuming billions of data points per day to ensure precision forms the foundation on which superior execution is built.
Follow us on LinkedIn to stay up to date with the latest series of Liquidity Matters, news and platform enhancements.
Episode 14: Spread Cost Precision Matters
Spread Curves: It's Complicated
Average bid-offer spreads are the industry's preferred liquidity benchmark. Investors use them with volume and volatility data to formulate asset and security selection decisions. Traders use them for pre-trade cost estimates and scheduling, and post-trade analysis that sits at the heart of best execution. In the ETF world they underpin an Issuer's obligations to monitor the market quality of their products. But the measures are a complicated beast, with multiple dimensions and nuances. The average can deceive.
With European ETF assets at record levels and post-MiFID II scrutiny on best execution intensifying, precision in spread measurement matters more than ever. On April 7, 2026 a single spike in spreads over a five-minute window at 11.10 am UK time pushed the most-traded group of European-listed US Equity trackers from its 20-day average of 2.7 bps to nearly 12 bps, over four times its normal level. That 300-second window was large enough to leave a footprint on the 20-day average for the entire month. This episode continues the spreads work begun in Liquidity Matters Episode 3 and Episode 8, with finer resolution and a closer look at what the daily average conceals in a specific ETP context.
For the analysis we built an interactive chart of 12 of the most traded European-listed ETFs and one ETP, grouped by underlying benchmark into US Equity, Global Developed, European Equity, Physical Commodity and Commodity-Sector Equity. Spreads are measured as consolidated EBBO, time-weighted within each instrument and volume-weighted within each group, in five-minute bins for 20 trading days in April 2026. The upper panel shows the 20-day average; the lower panel shows individual daily curves. Use the date selector and the legend filters to explore the data yourself and hover over the chart to view the data by bin. You can easily compare a normal trading day against April 7 in the same asset class, or switch asset classes to see how the regime structure changes across the market.
Producing this picture is complicated; nanosecond-aligned data from every venue is required to ensure the correct sequence of bid and offer changes across up to five lit books, for thousands of traded ETP and equity instruments every day. Let's look at the key features.
The intraday curve has structure
The spread curve is not random. It resolves into four distinct but predictable regimes for equity ETFs, with a fifth regime exclusive to commodity-linked products around the London gold fix.
At the European Open (08:00–08:20 UK) spreads widen sharply as ETFs and their underlyings begin trading simultaneously: European Equity averages 9 bps in the first five minutes (against its daily average of 6.2 bps) and Global Developed 13.1 bps (against 5.3 bps) with the latter taking 40 minutes longer to find the morning level. The continuous trading floor that follows is the calmest part of the daily session, with each group trading below its own daily average: US Equity at 2.3 bps (against its daily average of 2.7 bps). The Global Developed group also shows lower spreads in the morning at 4.5 bps (against 5.3 bps) reflecting the substantial US weighting. European Equity hugs its daily average for most of the day at 5.8 bps in the morning (against 6.2 bps), more so than any other class.
At 13:25 (UK time) spreads widen for every group in anticipation of the US macro announcements release window; even the European Equity group spreads move out 10.6 bps, reflecting the read-across in global sectors. A short pause back at average spread levels evolves into the US Open at 14:30 - the most volatile part of the day for around 90 minutes, where US-underlying product spreads widen sharply to take into account new information.
Our chosen Gold physical ETP and Commodity-Sector Equity ETFs are among the most traded ETPs at the moment and therefore make the cut for inclusion in this episode but they only represent the gold and silver markets. The ETFs reach 5.1x their morning level reflecting the US weighting of NYSE and TMX listed miners and the ETP’s response to the increase in COMEX futures liquidity.
Within each regime, spreads are mean-reverting, usually pulling back within minutes of any out-of-regime spike. Market makers price expected information flow into their quotes to reflect risk premiums and uncertainty, and that flow is not constant through the day.
Why variation matters as much as the level
The regimes describe a shape. The level on any given day varies sharply with the effect of shocks and outliers. For example on April 14, the European Equity ETF group reached 45.5 bps in a single five-minute bin at 13.30 - over four times the 20-day average of 10.6 bps for that window. Strip that day out of the calculation and the 20-day average at 13:30 falls from 10.6 bps to 8.8 bps.
In the next episode of Liquidity Matters we will investigate how spread volatility and level evolves on ‘messy days’ compared to the average, and how random events often have an overweighted impact on average spreads. Precision is required to adjust and normalise these events.
Asset classes add a further dimension
The regime structure also differs substantially between asset classes, and not only in level but in shape with a wide range even within the same benchmarks and the country venues they trade on. Commodity-Sector Equity ETFs mostly track the US equity session and have a fifth discernible regime around the London gold fix at midday when spreads step up from 8.4bps to 17bps and remain there for the rest of the day. We will also investigate this in the next episode.
Conclusion
A daily aggregate is not precise enough to measure the true cost of liquidity, nor to identify trends in that cost over time. Variation is heavily skewed, since spreads blow out but never blow in, and a few outlier moments can pull a monthly aggregated average well above that typically experienced on a normal trading day. The scale of data involved in creating precision spreads runs to over two billion data points a day at nanosecond timestamp granularity.
For portfolio managers who use ETPs for asset exposure at country and sector level, for diversification and inflow management, selection of the right product from a stable of similar products relies on metrics such as spreads to assess liquidity characteristics. Issuers know this and rely on quality data to compare their products with competitors for both passive and rapidly growing active styles. Getting access to high quality, precision data remains a major operational challenge for investors, trading firms and ETP issuers alike.
Note on Methodology: the data behind this episode is the bid/offer spread at touch, consolidated across relevant venues. The xyt product set includes effective spreads with mark-outs (covered in Liquidity Matters Episode 8) and spread at depth for a range of notional value equivalent trades. These improve comparison with other products and trends over time and help to identify the liquidity premium, reflecting the spread as it applies to orders of different sizes. We will return to these topics in future episodes including a deep dive into spreads associated with stress days.
Episode 15: How Spreads at Depth Metrics Help ETF Issuers Manage Liquidity In Volatile Markets
When markets opened on 7 April 2026, the first trading day after Easter, the At-Touch spread on Vanguard's S&P 500 UCITS ETF (‘VUSA’), reached 31 bps, 9x its 20-day average for the opening five minutes. The move was not specific to VUSA. It was visible across the 15 most traded European listed ETFs. Yet despite substantial volatility in the spreads for much of the session, the difference between the average At-Touch spread and the average spread for a simulated €100k trade was just 2.6bps for most of the day, illustrating how the structure of liquidity remained intact.
This was a macro shock triggered by sweeping tariff changes announced by the US administration before the holiday, and the market was repricing on the news. In this episode of Liquidity Matters, we highlight the behaviour of the ETF market during a stress event through the lens of some enhanced spread metrics, used throughout the industry as a measure of the cost of liquidity.
Why this matters to issuers and their investors
ETF Capital Markets teams spend significant effort in supporting investors through periods like April 7 to help optimise trade timing and limit execution costs. Their role is not just to monitor liquidity but to explain its structure, especially during stress events, and to engage with market makers to maintain market quality. In this episode we look deeper than the simple ‘At-Touch’ (top-of-book spread) by adding three additional ‘Spread-at-Depth’ metrics; Spread at €10k, Spread at €25k and Spread at €100k, calculated using simulated aggressive orders that cut through several price levels. As with At-Touch spreads, the metrics are time-weighted, with tick by tick precision. The gap between At-Touch spread and the spreads at depth metrics reveals order book depth, and crucially the ‘liquidity premium’ paid for immediate liquidity by investors at size, measured in spreads.
Capital markets teams can use these deeper insights to engage with their investors in explaining the liquidity premium, and to highlight structural strength in their products, whilst investors can make cross product comparisons.
Explore the data
The interactive chart demonstrates this well. It shows the intraday spread profile for all 15 ETFs on 7 April, defaulted to VUSA in 5 minute bins with all four spread measures shown. Use the filter to compare ETFs and toggle each spread measure individually by selecting from the legend.
VUSA on 7 April illustrates the point precisely. At the open, the At-Touch spread was 30.7 bps, 9x its 20-day average, and the €100k depth spread reached nearly 60 bps within the first 20 minutes. Investors trading in size faced not only wide spreads but a significant liquidity premium, reflecting a thin order book in the immediate aftermath of the macro shock at the Open. That premium persisted for approximately 70 minutes. After 10:10 CET, while spreads remained elevated relative to their 20-day average, the gap between At-Touch and €100k depth narrowed to average 2.6bps for the remainder of the session. While spreads at all levels of depth took to the end of the day to return to normal levels, the spread premium reverted much more quickly, indicating that while the market was still pricing the macro uncertainty through wider spreads, the structural liquidity of VUSA remained intact.
The takeaway
In Episode 14 we showed that a single daily average understates the true range of trading costs and that greater precision is obtained by incorporating intraday spread curves to reveal the structure of spreads and the variation in the range depending on time of day. Episode 15 takes that another step further, showing how that range looks on stress days, and introducing ‘spreads at depth’ to measure the liquidity premium. This kind of information relies on high quality, precision data and helps Capital Markets teams to guide investors on execution timing during stable and stressed markets, and the expected execution costs depending on the liquidity demand of their trades.